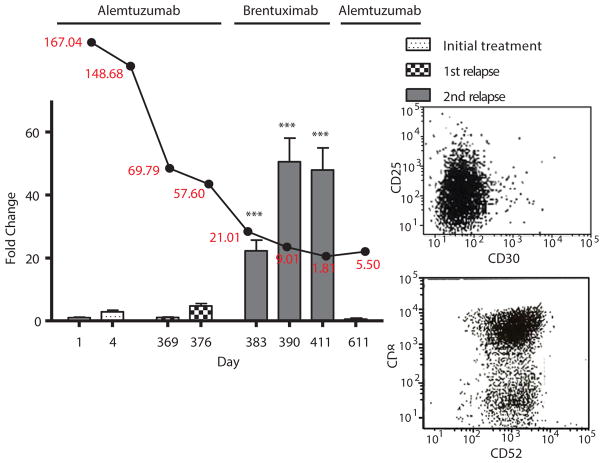
Figure 4. CD30 positivity correlates with response to brentuximab vedotin in patient 5.
For time points at which blood samples of patient 5 were available, CD30 status was assessed by qRT-PCR. This is represented by the bar graph with days on the x-axis. Values are reported as fold change compared to initial treatment naïve samples collected prior to study intervention. White blood cell counts (in red) from these same time points were also collected and graphed above their corresponding dates (black line graph). Antibody treatment received during each period is labeled above the graph. The inset to the right shows flow cytometry data of CD30 negative (top), CD52 positive (bottom) cell populations of the last time point at which CD30 expression was observed to disappear by qRT-PCR and subsequently treatment was switched back to alemtuzumab. ***p<0.0005. Bars represent mean fold change +/− SEM. N=3.

