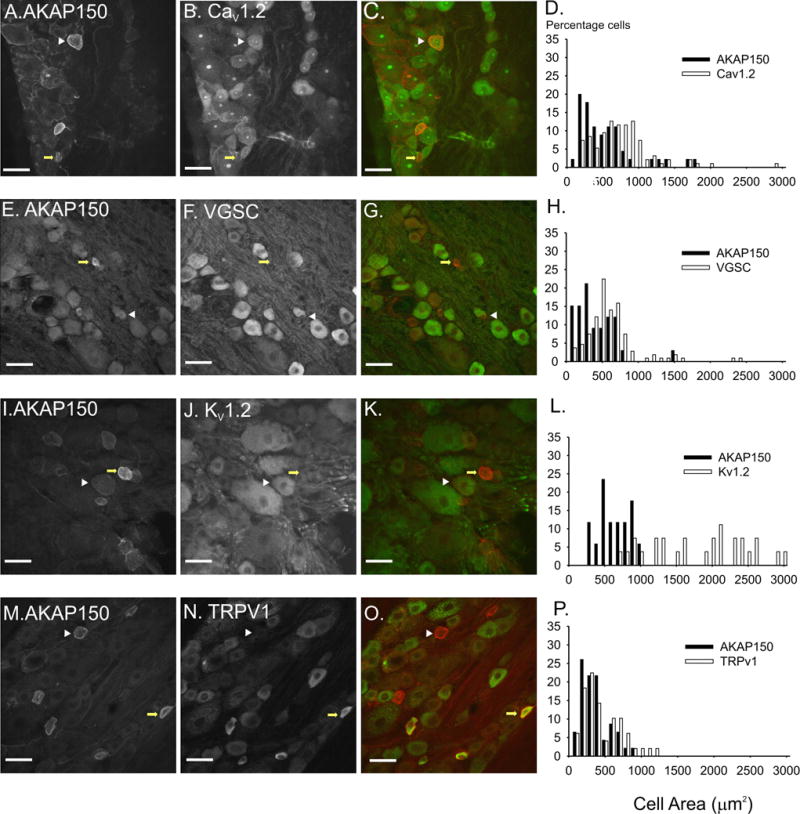
Figure 5. Characterization of AKAP150 expression with voltage gated ion channels and TRPV1 in rat DRG neurons.

The left panel of images shows AKAP150 expression (A,E,I,M), the middle panel shows the immunolocalization of ion channels CaV1.2 (B), Voltage gated sodium channel (VGSC) (F), Kv1.2 (J) and TRPV1 (N) and the right panel of images (C,G,K,O) is an overlay of AKAP150 (red) and the protein marker (green). White arrowheads mark DRG in which AKAP150 coexpresses with the protein marker. Yellow arrows mark DRG in which on AKAP150 is expressed. Scale bars = 50 μM. The histograms (D,H,L,P) demonstrate the narrow distritbution of AKAP150 positive DRG neuron areas and the braod areas of DRG expressing specific ion channels.
