

Abstract
This study analyses the sampling performance of three benthic sampling tools commonly used to collect freshwater macroinvertebrates. Efficiency of qualitative D-frame and square aquatic nets were compared to a quantitative Surber sampler in tropical Malaysian streams. The abundance and diversity of macroinvertebrates collected using each tool evaluated along with their relative variations (RVs). Each tool was used to sample macroinvertebrates from three streams draining different areas: a vegetable farm, a tea plantation and a forest reserve. High macroinvertebrate diversities were recorded using the square net and Surber sampler at the forested stream site; however, very low species abundance was recorded by the Surber sampler. Relatively large variations in the Surber sampler collections (RVs of 36% and 28%) were observed for the vegetable farm and tea plantation streams, respectively. Of the three sampling methods, the square net was the most efficient, collecting a greater diversity of macroinvertebrate taxa and a greater number of specimens (i.e., abundance) overall, particularly from the vegetable farm and the tea plantation streams (RV<25%). Fewer square net sample passes (<8 samples) were sufficient to perform a biological assessment of water quality, but each sample required a slightly longer processing time (±20 min) compared with those gathered via the other samplers. In conclusion, all three apparatuses were suitable for macroinvertebrate collection in Malaysian streams and gathered assemblages that resulted in the determination of similar biological water quality classes using the Family Biotic Index (FBI) and the Biological Monitoring Working Party (BMWP). However, despite a slightly longer processing time, the square net was more efficient (lowest RV) at collecting samples and more suitable for the collection of macroinvertebrates from deep, fast flowing, wadeable streams with coarse substrates.
Keywords: Sampling Tool, Macroinvertebrate Distribution, Sorting Time, Land Use
Abstract
Kajian ini menganalisa pencapaian tiga alat penyampelan bentik yang selalu digunakan untuk memungut makroinvertebrata air tawar. Kecekapan jaring kualitatif rangka-D dan jaring akuatik segi empat dibandingkan dengan penyampel kuantitatif Surber di sungai tropika di Malaysia. Kepelbagiaan dan kepelbagaian makroinvertebrata yang dipungut menggunakan setiap alat dinilai bersama variasi relatifnya (RV). Setiap alat digunakan untuk menyampel makroinvertebrata dari tiga anak sungai yang mengairi kawasan yang berbeza: satu kebun sayur, sebuah ladang teh dan satu hutan simpan. Kepelbagaian makroinvertebrata yang tinggi direkod pada kaedah pungutan jaring segi empat dan penyampel Surber di sungai berhutan; sungguh pun begitu kelimpahan spesies yang sangat rendah direkod pada penyampel Surber. RV yang agak besar pada pungutan penyampel Surber (RV 36% dan 28%) diperhatikan masing-masing pada anak sungai di kebun sayur dan di ladang teh. Di antara tiga kaedah penyampelan, jaring segi empat adalah paling cekap, memungut kepelbagaian taksa dan bilangan (kelimpahan) makroinvertebrata yang tinggi secara keseluruhan, terutamanya dari anak sungai di kebun sayur dan di ladang teh (RV<25%). Hanya sedikit tangkapan jaring segi empat (<8 sampel) sudah mencukupi untuk menjalankan penilaian biologi kualiti air, tetapi setiap sampel memerlukan masa memproses yang lebih panjang (±20 min) dibanding dengan alat penyampel yang lain. Sebagai kesimpulan, semua alat penyampel adalah sesuai untuk pungutan makroinvetebrata di anak sungai di Malaysia dan mengumpul himpunan yang menghasilkan keputusan kelas kualiti air biologi Family Biotic Index (FBI) dan Biological Monitoring Working Party (BMWP) yang serupa. Namun di sebalik masa pemprosesan yang lebih panjang, jaring segi empat adalah lebih cekap (RV paling rendah) untuk memungut sampel dan lebih sesuai untuk pungutan makroinvertebrata dari anak sungai yang boleh diharung yang dalam, berarus deras dengan substrata yang kasar.
Keywords: Alat Penyampel, Taburan Makroinvertebrata, Masa mengasing, Penggunaan Tanah
INTRODUCTION
Several qualitative and quantitative sampling tools are designed to collect benthic invertebrates (Barbour et al. 1999; Merritt et al. 2008), but none of these devices are an effective sampler in all habitats, particularly given differing stream degradation levels and site topographies. Both types of sampler (i.e., qualitative and quantitative) collect aquatic samples by physically removing macroinvertebrates from the substrate and trapping them in a net held downstream. Commonly used samplers such as the Surber sampler (Surber 1937), the Hess sampler (Hess 1941) and a D-frame net (Merritt & Cummins 1996) capture benthic organisms from stream substrates in very small areas (Surber: 0.09 m2, Hess: 0.09 m2, D-net: 0.3 m2). Extrapolating sample data from these methods to the square metre could lead to the overestimation of species abundance and diversity at the site due to the generally patchy distribution of invertebrates in streams (Downing 1979; Lancaster et al. 1991; Che Salmah et al. 2013). Collection of a large sample is required to accurately estimate the population size and diversity of a community, as well as to minimise the variance in measures of abundance (Needham & Usinger 1956; Allan 1982; Morin 1985; Che Salmah et al. 2007), especially in tropical streams where faunal abundance is thought to be low (Dudgeon 2008). In an attempt to minimise errors from using traditional samplers, Taylor et al. (2001) proposed the use of an electric shocker normally utilised in fish studies (Joy et al. 2013). This apparatus accumulates less debris, which reduces the sample processing time, and it facilitates the collection of a substantial number of invertebrates. Although this method can provide accurate estimates of population size and diversity, its efficiency is reduced and is less suitable in habitats with complex structures, such as woody debris or dense macrophyte (Portt et al. 2006), and it also threatens non-target organisms (Nielsen 1998). However, the vacuum benthos sampler (Brown et al. 1987) requires special equipment and a skilled operator to function efficiently (Lake 2013).
A sampling tool’s efficiency is also determined by the time required to process the samples (Taylor et al. 2001), especially in a rapid water quality or environmental assessment (Barbour et al. 1999). The amount of debris collected in the sample and the condition of the organisms collected (Hawking & New 1996) determine the sample processing time. A longer processing time is less desirable because, apart from being laborious and costly, prey species are readily exposed to predators, such as predatory odonate larvae, when collected together in the samples (Peckarsky & McIntosh 1998).
At present, two types of sampling tool are widely used to collect aquatic macroinvertebrates in Malaysia’s wadeable rivers (Merritt et al. 2008): the D-frame net (Che Salmah et al. 1999, 2001; Wahizatul et al. 2011, Al-Shami et al. 2013) and the Surber sampler (Othman et al. 2002; Azrina et al. 2006). These tools are used because they are practical and highly suited to sampling different habitats. However, in addition to only collecting within small substrate areas, these two sampling methods fail to collect macroinvertebrates drifting in the vertical water column above the height of the two tools (approximately 40 cm). Although quantitative collection using the Surber sampler is highly reliable in estimating the abundance and diversity of benthic invertebrates, its small size makes it difficult to set on rough substrates (Al-Shami et al. 2013) in deep water and often results in the loss of large organisms that are fast enough to crawl out of the front of the sampler (Hess 1941). A similar problem occurs with the D-frame net. Free-floating animals in the water column following physical disturbance of an area in front of the net can easily avoid the small net opening (approximately 40 cm) and escape collection in the fast flowing water of wide rivers.
Large samples are required to estimate populations in tropical rivers because these locales often have low invertebrate abundance and relatively high diversity (Dudgeon 2008). Although a number of samplers have been used in aquatic studies in Malaysia, their comparative performances have not been evaluated. In this study, we compared the efficiency and overall performance of three sampling tools, a large square net (0.5 m wide × 0.5 m high), a D-frame net (radius and height 0.38 m) and a Surber sampler (0.4 m wide × 0.4 m high) in the collection of freshwater aquatic macroinvertebrates. The objective of this study was to identify a sampling tool with high efficiency, good overall performance and high suitability for use in various aquatic habitats commonly encountered in Malaysian streams or wadeable rivers.
MATERIALS AND METHODS
Study Sites
We sampled macroinvertebrates in three high gradient rivers surrounded by different land uses in the Cameron Highlands, a high altitude landscape (approximately 2300 m a.s.l) located in the state of Pahang, Malaysia. The Bertam River (N04 26′34.1″ E101 23′16.6″) drains a vast area of vegetable farms; the Ulong River (N04 44′80.4″ E101 42′24.0″) flows through a tea plantation; and the Pauh River (N04 28′46.6″ E101 22′59.4″) passes through a large forest reserve. Based on Strahler (1957), Bertam River belongs to the third river order while both Ulong and Pauh are second order rivers. Measuring river parameter prior to macroinvertebrate collection, we found that average river width ranged from 2.8 m to 12.23 m wide. The water temperatures varied slightly from 16.67°C to 22.43°C and pH from 5.53–7.01, dissolved oxygen (DO) levels from 7.42–8.08 mgL−1 and conductivity from 13.17–62.93 uScm−1. In the Pauh and Bertam rivers, 30% of the substrate was boulder (>25.6 cm), while in the Ulong River the substrate was dominated by sand (50%).
Sampling Tool and Macroinvertebrate Collection
In this study, benthic macroinvertebrates were sampled from the rivers on one sampling occasion in May 2013. Two qualitative sampling tools (D-frame net and square net) and a quantitative sampling tool (Surber sampler) were used to collect the aquatic macroinvertebrates from each of the three rivers. All tools are suitable for sampling multiple habitats, have good potential to support a rapid biological assessment (RBA) and are relatively inexpensive to use. Moreover, these tools do not require a skilled operator to function. One person is able to handle the Surber sampler, whereas two people are required to operate the other two tools.
A D-frame net with a 1.2-m-long handle and a 60 cm long cone-shaped net with 0.3 mm mesh and a diameter of 0.38 m was used in this study. At sites with sandy substrate, the net was dragged against the water flow over an area of 1 m2 while large substrates were gently rubbed or kicked for 2 min with hands or feet, respectively, to dislodge free-living and burrowing aquatic macroinvertebrates from the river bed (Che Salmah et al. 2001; Che Salmah & Wahizatul Afzan 2005; Al-Shami et al. 2010a, b; Wahizatul et al. 2011). Cobble and boulders were hand-lifted, and their surfaces carefully rubbed to dislodge any aquatic macroinvertebrates into the net. A square frame net with a 0.5 m × 0.5 m opening, a 90 cm cone shaped net with 0.3 mm mesh, and a 1.2 m long handle were used to collect samples following a similar method to that employed for the D-frame net.
The third tool was a Surber sampler, 40 cm wide × 40 cm long and 40 cm high with 0.16 m2 catching area and a net of 0.3 mm mesh. The sampler was firmly embedded into the river substrate with its opening faced upstream, against the water flow. The area within the frame was disturbed to dislodge all animals in the substrate, and the animals were subsequently swept by the water and collected in the net. Larger substrates within the frame were placed into a bucket filled with water and gently scrubbed to detach any macroinvertebrates clinging to their surfaces. These macroinvertebrates were added to the collection. Ten aquatic macroinvertebrate samples were collected along a 100 m reach using each sampler, and a total of 90 samples were collected from the 3 streams. The difference in the substrate area sampled by each tool was considered a defining attribute of that tool. Macroinvertebrates collected via a net were transferred into labelled plastic bags containing a small amount of water. The macroinvertebrates were sorted and preserved in universal bottles containing 75% ETOH in the laboratory. They were identified using keys found in Merritt et al. (2008), Morse et al. (1994), Yule and Yong (2004), Jäch and Ji (1998; 2003) and Sangpradup and Boonsoong (2006).
Processing time was estimated and recorded as the time it took to sort all macroinvertebrates in a sample after it was emptied into a sorting tray. According to Taylor et al. (2001), the processing time is the duration (in min) taken to sort 100 individuals from a sample. Because the number of macroinvertebrates collected in most of our samples was less than 100, the duration spent to process a sample in this study was divided by the number of macroinvertebrates in each sample and multiplied by 100. To eliminate possible human error, the macroinvertebrates collected by all tools were sorted by the same person. The detritus collected in each sample was placed into an aluminium tray and dried in an oven at 60°C for 3 days. The dry mass was subsequently weighed using a AL-5000 microbalance (Denver Instrument, New York).
Data Analysis
Differences in the mean abundances of the macroinvertebrates collected by each of the three sampling tools from the three rivers were analysed using the Kruskal-Wallis test for non-normally distributed data. Levene’s test was applied to verify the homogeneity of the variances. Both the Kruskal-Wallis and Levene’s test were executed using the Statistical Package for the Social Sciences (SPSS Software Version 20.0). Relative variation (RV) was estimated to determine the efficacy of each sampling tool in macroinvertebrate collection. RV is defined as the ratio of the standard error of the mean (SEM) divided by the mean (m) and presented as a percentage (%).
A Sampling tool with an RV>25% is considered to have low precision (Southwood 1978) and a tool with the lowest RV represents the most efficient sampler in this study.
Box plots were constructed using SPSS Software Version 20.0 (IBM Corporation, New York) to represent the distribution of aquatic macroinvertebrates collected using different tools. Ecological indices of diversity (Shannon-Wiener Index, H’), richness (Margalef Index, R1) and evenness (Pielou Index, J) were calculated to compare the performance of each tool together with Alpha, Beta and Gamma diversity scores. All indices were generated using the SDR Program of Ecological Methodology (2nd ed., Exeter Software, New York) and Species Richness and Diversity (Version 4.1.2, PISCES Conservation Ltd., Hants, UK). The biological water quality indices Biological Monitoring Working Party (BMWP) (Armitage et al. 1983) and Family Biotic Index (FBI) (Hilsenhoff 1988) were calculated to compare water quality classifications corresponding to macroinvertebrate assemblages collected using different sampling tool. The distribution pattern of dominant intolerant insects was expressed using the Ephemeropteran, Plecoptera and Trichoptera (EPT) Richness Index (Lenat 1993). The relative tendency of each tool to collect a certain group of macroinvertebrates was determined by analysing variations in the number of dominant and rare taxa. Aquatic macroinvertebrate richness was estimated using the rarefaction analysis in BioDiversity Pro® (SAMS, Argyll, UK). The sampling tool associated with the maximum richness value at similar abundance levels to the other tools was identified using the rarefaction curves.
RESULTS
The total and relative abundances of aquatic macroinvertebrates collected using the three sampling techniques are listed in Table 1. Species richness and diversity varied significantly (Kruskal Wallis, p<0.0001) for macroinvertebrates collected from all three rivers using different sampling tool. The Levene’s test justified the homogeneity of the variances in all samples at p>0.05. The lowest macroinvertebrate abundance were found in the Surber sampler collection (30.23±5.05), but diversities within the samples collected using this tool were comparable to diversities in the square net sample (41) and were slightly higher than those in the D-frame net collection (40). High species abundance and diversity values were recorded for all square net samples (63.3±9.5).
Table 1:
Total and relative abundance of aquatic macroinvertebrate taxa in rivers of the Cameron Highlands, Pahang, collected using three sampling tools: the Surber sampler, D-frame net and square net.
| Order | Family | Genus | Abundance (Relative abundance %) | ||
|---|---|---|---|---|---|
|
| |||||
| Surber sampler | D-frame net | Square net | |||
| Platyhelminthes | 2 (0.22) | 34 (2.51) | 17 (0.89) | ||
| Annelida | Eupobdellidae | 14 (1.54) | 38 (2.81) | 31 (1.63) | |
| Oligochaeta | 15 (1.65) | 44 (3.25) | 72 (3.79) | ||
| Mollusca | Physidae | Physa | 143 (15.77) | 127 (9.39) | 211 (11.11) |
| Lymnaeidae | Lymnaea | 39 (4.30) | 12 (0.89) | 32 (1.68) | |
| Thiaridae | Melanoides | – | – | 1 (0.05) | |
| Amerianna | 9 (0.99) | – | 1 (0.05) | ||
| Planorbiidae | Indoplanorbis | 68 (7.50) | 58 (4.29) | 82 (4.32) | |
| Brachyura | Sesarmidae | Varuna | 1 (0.11) | 3 (0.22) | – |
| Crustacea | Amphipoda | 1 (0.11) | – | – | |
| Isopoda | – | 5 (0.37) | – | ||
| Collembola | Mackenziellidae | 4 (0.44) | 2 (0.15) | – | |
| Coleoptera | Noteridae | 2 (0.22) | 18 (1.33) | – | |
| Curculionidae | 1 (0.11) | – | – | ||
| Psephenidae | 1 (0.11) | 3 (0.22) | 7 (0.37) | ||
| Gyrinidae | – | – | 4 (0.21) | ||
| Eulicadidae | Eulicas | – | – | 3 (0.16) | |
| Hydrophilidae | Berosus | – | – | 2 (0.11) | |
| Hydrophilidae | 1 (0.11) | 1 (0.07) | – | ||
| Dytiscidae | Laccophilus | – | 1 (0.07) | – | |
| Dytiscidae | – | 4 (0.30) | – | ||
| Hemiptera | Naucoridae | Gestroiella | 10 (1.10) | 9 (0.67) | 21 (1.11) |
| Geriidae | Metrocoris | 14 (1.54) | 3 (0.22) | 1 (0.05) | |
| Aphelocheridae | Aphelocheirus | – | 1 (0.07) | – | |
| Corixidae | Micronecta | – | 2 (0.15) | – | |
| Odonata | Libelullidae | Tholymis | – | 1 (0.07) | – |
| Libelullidae | – | – | 1 (0.05) | ||
| Aeshnidae | Aeshna | – | 1 (0.07) | 2 (0.11) | |
| Chlorogomphidae | Chlorogomphus | 6 (0.66) | 11 (0.81) | ||
| Euphaeidae | Eupahea | – | 0 (0.00) | 1 (0.05) | |
| Ephemeroptera | Baetidae | Baetis | 196 (21.61) | 300 (22.17) | 406 (21.37) |
| Heptageniidae | Thalerosphyrus | 21 (2.32) | 17 (1.26) | 10 (0.53) | |
| Campsoneuria | 17 (1.87) | 5 (0.37) | 60 (3.16) | ||
| Epeorus | 2 (0.22) | 5 (0.37) | 5 (0.26) | ||
| Ephemeridae | Ephemera | – | – | 1 (0.05) | |
| Leptophlebiidae | Habrophlebiodes | – | – | 3 (0.16) | |
| Plecoptera | Perlidae | Kamimuria | 13 (1.43) | 21 (1.55) | 9 (0.47) |
| Etrocorema | – | – | 4 (0.21) | ||
| Phanoperla | 7 (0.77) | 62 (4.58) | 42 (2.21) | ||
| Peltoperlidae | Cryptoperla | – | – | 3 (0.16) | |
| Nemouridae | Amphinemoura | 7 (0.77) | 12 (0.89) | – | |
| Indonemoura | 17 (1.87) | 39 (2.88) | 78 (4.11) | ||
| Lepidoptera | Pyralidae | Eouphyla | 1 (0.11) | – | – |
| Trichoptera | Polycentropodidae | 2 (0.22) | – | – | |
| Hydropsychidae | Diplectrona | 18 (1.98) | 13 (0.96) | 16 (0.84) | |
| Hydropsyche | 81 (8.93) | 172 (12.71) | 253 (13.32) | ||
| Hydropsychinae | 4 (0.44) | – | – | ||
| Oestropsyche | – | – | 1 (0.05) | ||
| Lepidostomatidae | Lepidostoma | 3 (0.33) | 23 (1.70) | 31 (1.63) | |
| Brachycentridae | 1 (0.11) | – | – | ||
| Ecnomidae | Ecnomus | – | 6 (0.44) | – | |
| Philopotamidae | Chimara | 2 (0.22) | – | – | |
| Sericostomatidae | Gumaga | 1 (0.11) | – | – | |
| Leptoceridae | – | 3 (0.22) | – | ||
| Ceraclea | – | – | 6 (0.32) | ||
| Setodes | 1 (0.11) | – | 6 (0.32) | ||
| Odontoceridae | Psilotreta | 2 (0.22) | 2 (0.15) | 12 (0.63) | |
| Diptera | Chironomidae | 50 (5.51) | 203 (15.00) | 257 (13.53) | |
| Simuliidae | Simulium | 124 (13.67) | 83 (6.13) | 167 (8.79) | |
| Emphididae | Clinocera | 0 (0.11) | 4 (0.45) | – | |
| Dolichopodidae | 1 (0.11) | 2 (0.15) | 1 (0.05) | ||
| Syrphidae | – | – | 1 (0.05) | ||
| Tipulidae | Tipula | 1 (0.11) | – | 12 (0.63) | |
| Culicidae | 3 (0.33) | – | – | ||
| Athericidae | Suragina | – | 1 (0.07) | – | |
|
| |||||
| Abundance (diversity) | 806 (41) | 1360 (40) | 1897 (41) | ||
| Mean±SE | 30.23±5.05 | 45.1±9.3 | 63.3±9.5 | ||
Note:
SE = standard error.
Baetis (family Baetidae), molluscs (Physa), trichopteran Hydropsyche and dipteran Simulium were identified as the most abundant genera collected by all three sampling techniques, and they represented the dominant macroinvertebrate genera in the rivers of the Cameron Highlands. The highest abundances of these genera were collected by the square net, a fact that was directly correlated with the net’s larger sampling area (i.e., the square net collected double the number of Baetis collected by the Surber sampler and two thirds the number collected using the D-frame net). Given the small sampling area surveyed using the Surber sampler, the recorded abundance and especially the diversity values were high. Less mobile taxa such as Physa and Simulium were well represented in the Surber samples. The actively moving gerrid Metrocoris was also collected in large numbers using this method because these insects moved within a confined area of shallow water within the sampler and thus were easily caught. Meanwhile, some genera, such as ephemeropteran Campsoneuria, trichopteran Psilotreta and dipteran Tipula, were better represented in the square net samples. However, 10 of the genera listed in Table 1 were only recorded in the D-frame net samples, and greater abundances of plecopteran, Kamimuria, Phanoperla, and Amphinemoura were also recorded using this method. Overall, however, the Surber sampler collected only 42% of the macroinvertebrate abundance collected by the square net, whereas the D-frame net collected 72% of the square net total. Variations in the data distribution are shown in Figure 1. The amount of data collected corresponded with the size of the area sampled by each method.
Figure 1:

Abundance of aquatic macroinvertebrates collected from rivers draining different land uses in the Cameron Highlands using three sampling tools.
Each sampling tool’s performance related to the collection of benthic macroinvertebrates from rivers draining different land uses is compared in Table 2 and Figure 2. In general, the highest macroinvertebrate abundances were recorded in the pristine river (Pauh River) running through the forest reserve, followed by the Ulong River draining the tea plantation and passing the highly disturbed vegetable farms. The highest diversity (H’) and richness (except for the tea plantation) values were recorded in samples taken using the D-frame net. Meanwhile, the lowest taxonomic variation (β diversity) was recorded in samples from square net collections (except for the tea plantation) and the highest variation was found in Surber sampler samples (Table 2). The D-frame net method further captured the richest and highest community diversity values in the vegetable farm and forest-reserve samples. Macroinvertebrate diversity collected by all sampling tools was in general poorly distributed in all types of land uses. The EPT Index was extremely low in the highly disturbed river (EPT Index <10), but the Surber sampler recorded the highest EPT score of all three methods in this land use type. In the forest reserve, higher EPT Index values were recorded, and again the Surber sampler collected the greatest number of these tolerant genera (17), likely because of the method’s ability to capture burrowing trichopterans or ephemeropterans. The dominant taxon in the Surber sampler collection was a less motile insect (Simulium), which attaches itself to substrate. Except for BMWP, biological water quality was similarly classified for all rivers regardless of the tool used (Table 3). However, the rarefaction prediction of macroinvertebrate diversity measured from different tool samples indicated that using the Surber sampler was more effective than the other two methods (Fig. 3). Nevertheless, at higher abundance levels (i.e., >1500), the differences in diversity may not be very obvious between tools.
Table 2:
Performances of three sampling tools in the collection of macroinvertebrates from rivers draining different land uses in the Cameron Highlands, Pahang.
| Vegetable farm | Tea plantation | Forest reserve | |||||||
|---|---|---|---|---|---|---|---|---|---|
|
| |||||||||
| Surber | D-frame | Square | Surber | D-frame | Square | Surber | D-frame | Square | |
| Means±SE | 133± 477 | 31.5±5.50 | 374±5.67 | 35.1±9.97 | 33.1±6.42 | 53.7±9.98 | 42.3±8 58 | 70.7±13.8 | 98.9±22.67 |
| Alphamin | 1 | 2 | 2 | 4 | 4 | 3 | 5 | 7 | 9 |
| Alphamax | 3 | 6 | 6 | 10 | 9 | 11 | 12 | 14 | 18 |
| Alphaaverage | 1.7 | 3.9 | 4.7 | 6.2 | 6.3 | 7.2 | 8.8 | 10.8 | 13.5 |
| Beta | 2.53 | 1.82 | 0.91 | 2.06 | 1.06 | 1.36 | 2.18 | 1.96 | 1.37 |
| Gamma | 6 | 11 | 9 | 19 | 13 | 17 | 28 | 32 | 32 |
| Shannon H′ | 0.2838 | 0.9159 | 1.119 | 1.871 | 1.843 | 1.705 | 2.354 | 2.568 | 2.445 |
| Margalef R1 | 1.022 | 1.738 | 1.35 | 3.071 | 2.068 | 2.545 | 4.465 | 4.725 | 4.495 |
| Pielou J′ | 0.06 | 0.16 | 0.19 | 0.32 | 0.32 | 0.27 | 0.39 | 0.39 | 0.35 |
| EPT index | 3 | 1 | 1 | 4 | 4 | 4 | 17 | 13 | 16 |
| Dominant taxa | Baetidae | Baetidae | Baetidae | Physidae | Physidae | Physidae | Simuliidae | Hydropsychidae | Hydropsychidae |
Notes: SE = Standard error; EPT Index = Ephemeroptera, Plecoptera and Trichoptera Index.
Figure 2:

Box plots of macroinvertebrate abundance collected using different sampling techniques in three rivers in the Cameron Highlands, Pahang (circle, median; box, 25th and 75th quartiles; whiskers, inter-quartile range).
Table 3:
Scores and water quality classification by FBI and BMWP of the macroinvertebrates collected from rivers draining different land uses using three sampling tools.
| Land use | Sampling tool | FBI | Water quality | BMWP | Water quality |
|---|---|---|---|---|---|
| Vegetable farm | Surber | 3.87 | Very good | 20 | Poor |
| D-frame | 3.87 | Very good | 24 | Poor | |
| Square | 3.41 | Very good | 19 | Poor | |
| Tea plantation | Surber | 0.87 | Excellent | 46 | Moderate |
| D-frame | 1.16 | Excellent | 39 | Poor | |
| Square | 1.92 | Excellent | 45 | Moderate | |
| Forest reserve | Surber | 2.60 | Excellent | 88 | Good |
| D-frame | 2.26 | Excellent | 105 | Very good | |
| Square | 2.25 | Excellent | 123 | Very good |
Figure 3:

Rarefaction analysis of aquatic macroinvertebrate richness in rivers of the Cameron Highlands, collected using different sampling tools.
Based on the RV values (Table 4), the square net and the D-frame net efficiently collected macroinvertebrates from rivers in disturbed areas (i.e., the vegetable farm and tea plantation), generating RV values of <25%. On the other hand, the Surber sampler was more efficient for collections performed in a pristine forested stream. In disturbed areas, the Surber sampler had high RV values (>25%). An RV of 25% is equivalent to a sampling error of 20% (Southwood 1998), which is the maximum error level accepted in aquatic sampling (Elliot 1972).
Table 4:
Efficiency of sampling tool (RV) for macroinvertebrate collections from rivers draining different land uses in the Cameron Highlands, Pahang River Basin.
| Sampling tool | RV (%) | ||
|---|---|---|---|
|
| |||
| Vegetable farm | Tea plantation | Forest reserve | |
| Surber | 36 | 28 | 20 |
| D-frame | 17 | 19 | 20 |
| Square | 15 | 19 | 23 |
The sample processing time was faster for D-frame net samples than Surber sampler and square net samples (Table 5) because of smaller quantity of sediment and detritus (13.36 g) collected with the organisms. The Surber sampler accumulated 82.62 g of debris in its samples, while the square net collected 179.12 g of debris. However, samples from the D-frame net and Surber sampler required similar amounts of time to process. When processing time was estimated per 100 organisms, samples required approximately the same duration (19.84 to 21.74 min) to sort through; in fact, the greatest amount of time was spent processing the D-frame net samples because of the low diversity and abundance of the organisms present.
Table 5:
Time taken to process each macroinvertebrate sample and 100 aquatic macroinvertebrates collected using the Surber sampler, D-frame net and square net and associated amount of detritus (inorganic and organic material) in each sample.
| Sampling tool | Time (min) (100 macroinvertebrates−1) | Detritus (g) |
|---|---|---|
| Surber | 10.54 (19.84) | 82.62 |
| D-frame | 9.47 (21.74) | 13.36 |
| Square | 18.31 (20.83) | 179.12 |
Of the three collection techniques, the rarefaction curves (Fig. 3) predicted that the Surber sampler would produce the highest generic diversity results at the lowest abundance. The lowest genetic diversity was observed in collections from the square net. The species-accumulation curves of macroinvertebrate samples from different land uses show the rate at which new genera were discovered within a community (Fig. 4). In the tea plantation samples, 80% of taxa diversity was recorded after four site samples were reviewed, and all taxa were successfully catalogued after eight samples (Fig. 4a). Fewer samples were required to catalogue vegetable farm diversity (Fig. 4b), and 5 to 8 samples were needed to record 80% to 100% of taxa diversity presumably available in the forest reserve river (Fig. 4c).
Figure 4:
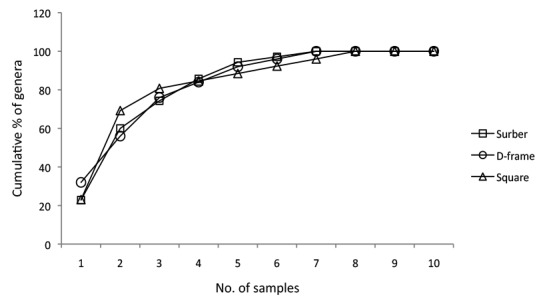


The species-accumulation curves of macroinvertebrates collected using different sampling tools in rivers draining different land uses: a) tea plantation; b) vegetable farm; c) forest reserve.
DISCUSSION
Of the three sampling tools, the square net collected a much greater abundance of macroinvertebrates than the Surber sampler or the D-frame net. This was expected due to the larger area sampled by the square net (approximately 0.25 m2 area) compared with the Surber sampler (0.16 m2), although a larger area (approximately 1 m2) was disturbed in front of the D-frame net. Furthermore, the height of the square net permitted fewer macroinvertebrates to drift away from the net in the water column and escape collection compared with the Surber sampler and the D-frame net. Hughes (1989) suggested that the area disturbed within the Surber sampler is exposed, providing an opportunity for aquatic fauna to escape. In deep, fast flowing water, more animals may be carried away from the sampler’s net.
In this study, all sampling tool tended to collect more common taxa present in the habitat. The square net and D-frame net captured more easily dislodged and highly mobile taxa, whereas the more intensive Surber sampler collected the sessile and closely adherent taxa. Two families, Simuliidae (Order Diptera) and Physidae (Order Mollusca), had higher relative abundances represented in the Surber sampler samples compared with those found in the D-frame net and square net. In contrast, both the D-frame and square net samples indicated high abundances of actively moving insects, such as Odonata, some trichopterans and ephemeropterans. The results obtained in this study generally agree with a previous study by Hornig and Pollard (1978); these researchers recorded larger numbers of easily dislodged and highly mobile taxa using the D-frame net and more sessile and closely adherent taxa using the Surber sampler. As in the present study, they collected a large number of macroinvertebrates from the family Simuliidae (Order Diptera), a group of aquatic insects that restrict their developmental stages to a single habitat (De Moor et al. 1986), as well as the family Physidae (Order Mollusca), which moves very slowly in its aquatic environment (Kappes & Haase 2012), using the Surber sampler. Interestingly, actively striding hemipteran gerrids were recorded most often in the Surber sampler sample in the present study. It is likely that the shallow water and confined area within the sampler prevented their escape, which allowed them to be caught quickly by the operator.
In the forested river, very high faunal diversity was recorded; this is supported by the fact that high environmental quality usually correlates with the greatest species richness and diversity. Of the three sampling tools, the Surber sampler collected a more diverse and richer macroinvertebrate assemblage in comparison with the qualitative sampling methods. Storey et al. (1991) reported consistently higher taxonomic richness using the Surber sampler than using qualitative tools and postulated that D-frame net and square net samples were biased towards collecting abundant over rare taxa. Similarly, Gillies et al. (2009) concluded that the D-frame net collected more abundant, widespread, and large animals.
In this study, the rarefaction prediction of species richness (Fig. 3) provided an important comparison of macroinvertebrates richness collected using different sampling techniques and independent of abundance. The rarefaction analysis was performed by plotting the number of species as a function of the number of individual animals. When abundance along all rarefied curves was compared at the lowest level (n = 806), the greatest richness (diversity) value (41) belonged to the Surber sampler. Therefore, higher macroinvertebrate diversity was recorded in the Surber sampler collection, although that method collected less than half the abundance gathered using the square method. The fact that the curves for the square and D-frame nets were flatter to the right indicated that a reasonable number of organisms had been gathered through an intensive sampling of the habitats. A few more samples using the Surber sampler would result in a better curve gradient, which would provide clearer comparisons with the other two sampling tools.
A comparison of each tool’s efficiency shows that the square net and D-frame net consistently demonstrated high sampling precision across the three rivers. Low precision was observed in the Surber sampler, especially in the vegetable farm and tea plantation rivers. According to Southwood (1978), sampling techniques with RV >25% have low precision and those with RV values of 25% or lower have good sampling precision. An RV of 25% is equivalent to a sampling error of 20% (Southwood 1998), which is the maximum error level accepted in aquatic sampling (Elliot 1972). In this study, square net samples demonstrated the highest precision values, except in the forested river samples, but they were still acceptable. This result indicates that the square net was most efficient at collecting macroinvertebrates, especially in rivers impacted by human activities. Meanwhile, although less efficient, the Surber sampler collected a greater diversity of fauna, particularly in pristine water bodies, presumably because of the availability of more productive (Merritt & Cummins 1996) and heterogeneous habitats in the rivers (Magurran 2004).
Species abundance values vary based on multiple factors and may lead to different conclusions as a result of the precision of the tool used to collect samples in different microenvironments. For instance, when Stark (1993) and Mackey et al. (1984) compared collections from a Surber sampler with those from a D-frame net, they found that the D-frame net collected more taxa than the Surber sampler based on a species-sampling analysis. The opposite was observed in the present study, where more taxa were collected using the Surber sampler, even though the D-frame and square nets caught greater total abundances. The specific river environment sampled may influence the proliferation of certain taxa and the specific behaviours of those taxa in certain habitats, such as the less active Ephemeroptera, Trichoptera, and Plecoptera in low-order rivers (Merritt & Cummins 1996). However, in the forested river, the D-frame net samples yielded higher diversity values (H’ = 4.725, Table 2) than the Surber sampler and the square net.
Because sample collection using these three sampling tools was based on traditional methods that require physical disturbance of the substrate to induce macroinvertebrate drifting in the water column, a large amount of debris was collected in each sample. A rapid sample processing time is important to avoid predatory macroinvertebrates, such as odonate larvae, from eating prey species collected within the same samples (Peckarsky & McIntosh 1998). Faster sample processing is also essential to reduce costs, especially during RBAs of water quality (Barbour et al. 1999) or in research that requires live specimens, such as a dietary study (Hawking & New 1996).
In this study, the D-frame net samples were processed fastest (per sample) when compared with the Surber sampler and the square net. However, when analysed as time per 100 specimens, the Surber sampler proved faster. This contrasted with the findings in Taylor et al. (2001), who found that it took longer to process the Surber’s collection. Many cobbles were enclosed in the sampler, and hence, less debris was found within the sample during processing. Along these lines, Peckarsky (1991) and Scrimgeour et al. (1993) suggested a way to overcome sampling a small collection area (volume) in stony substrate using Surber’s sampler; they recommend individual stone sampling. In contrast, the square net samples contained the largest amount of detritus, especially in the fast water samples because the net collected macroinvertebrates over a larger substrate area. Consequently, the samples collected via this method took the longest to process.
Armitage et al. (1983) suggest that a collection of at least 75% of total taxa will provide a reliable assessment of water quality in a temperate habitat. When the sample replicates were plotted against cumulative percentage of taxa (diversity) in Figure 4, the Square net was shown to require the fewest number of samples to collect 80% to 100% taxa presumed to live in the habitat, especially in the vegetable farm river. In the tea plantation, however, the same number of replicates (8) was required regardless of the method used. Unlike the species-poor sites (vegetable farms or a tea plantation), more replicates were required to accumulate a good representation of the taxa living in the pristine forest stream. To obtain total representation, collections of 8–9 samples (replicates) generated 100% habitat diversity and were sufficient for a water quality assessment.
CONCLUSION
This study highlighted the performance of different sampling tools used to collect macroinvertebrates in wadeable rivers in Malaysia. The square net method had the lowest RV and resulted in the greatest macroinvertebrate abundance values of all the methods, especially in deep, fast flowing streams. In addition, the square net had the tendency to capture more active taxa in fast flowing waters with coarse substrates and less detritus per specimen than the other methods. Due to the low diversity found in disturbed waters, fewer replicates were required to identify all taxa in impacted areas, such as vegetable farms and tea plantations. This study also indicated that the Surber sampler was more suitable for the collection of samples from shallow, pristine rivers. Given that this method tends to collect rare taxa, the Surber sampler should be used in studies focusing on taxa diversity, such as the RBA of water quality. However, the square net method is more efficient and suitable for population studies, as it is equally useful for RBAs, particularly in deep, wadeable rivers (>0.5 m) with heterogeneous substrates.
Acknowledgments
This study was supported by Fundamental Research Grant Scheme (FRGS) no. 6711224 from the Ministry of Higher Education, Malaysia. Transportation and laboratory facilities were furnished by the School of Biological Sciences, Universiti Sains Malaysia. We are grateful to various individuals, in particular Azhari, Anuar, Nurul Huda, Dhiya Shafiqah, Aida, Aiman Hanis, and Jamsari for their assistance in the field. The first author was partially supported by the MyBrain15 fellowship of the Ministry of Higher Education, Malaysia.
REFERENCES
- Allan JD. The effects of reduction in trout density on the invertebrate community of a mountain stream. Ecology. 1982;63(5):1444–1455. [Google Scholar]
- Al-Shami SA, Che Salmah MR, Abu Hassan A, Madziatul Rosmahanie M. Biodiversity of stream insects in the Malaysian Peninsula: Spatial patterns and environmental constraint. Ecological Entomology. 2013;38(3):238–249. [Google Scholar]
- Al-Shami SA, Che Salmah MR, Abu Hassan A, Siti Azizah MN. Distribution of Chironomidae (Insecta: Diptera) in polluted rivers of the Juru River Basin, Penang, Malaysia. Journal of Environmental Science. 2010a;22(11):1718–1727. doi: 10.1016/s1001-0742(09)60311-9. [DOI] [PubMed] [Google Scholar]
- Al-Shami SA, Che Salmah MR, Siti Azizah MN, Abu Hassan A, Ali A. Morphological deformities in Chironomus spp. (Diptera: Chironomidae) larvae as a tool for impact assessment of anthropogenic and environmental stresses on three rivers in the Juru River System, Penang, Malaysia. Environmental Entomology. 2010b;39(1):210–222. doi: 10.1603/EN09109. [DOI] [PubMed] [Google Scholar]
- Armitage PD, Moss D, Wright JF, Furse MT. The performance of a new biological water quality score system based on macroinvertebrates over a wide range of unpolluted running water sites. Water Research. 1983;17(3):333–347. [Google Scholar]
- Azrina MZ, Yap CK, Rahim Ismail A, Ismail A, Tan SG. Anthropogenic impacts on the distribution and biodiversity of benthic macroinvertebrates and water quality of the Langat River, Peninsular Malaysia. Ecotoxicology and Environmental Safety. 2006;64(3):337–347. doi: 10.1016/j.ecoenv.2005.04.003. [DOI] [PubMed] [Google Scholar]
- Barbour MT, Gerritsen J, Snyder BD, Stribling JB. Rapid bioassessment protocols for use in streams and wadeable rivers. In: US Environmental Protection Agency (USEPA), editor. Periphyton, benthic macroinvertebrates and fish. 2nd ed. Washington DC: Office of Water, USEPA; 1999. [Google Scholar]
- Brown AV, Schram MD, Brussock PP. A vacuum benthos sampler suitable for diverse habitats. Hydrobiologia. 1987;153(3):241–247. [Google Scholar]
- Che Salmah MR, Al-Shami SA, Madziatul Rosemahanie M, Abu Hassan A. Biological and ecological diversity of aquatic macroinvertebrates in response to hydrological and physicochemical parameters in tropical forest streams of Gunung Tebu, Malaysia: Implications for ecohydrological assessment. Ecohydrology. 2013;7(2):496–507. [Google Scholar]
- Che Salmah MR, Abu Hassan A, Jongkar G. Diversity of Ephemeroptera, Plecoptera and Trichoptera in various tributaries of Temenggor Catchment, Perak, Malaysia. Wetland Science. 2007;5(1):20–31. [Google Scholar]
- Che Salmah MR, Wahizatul Afzan A. Preliminary study on the composition and distribution of Odonata in Perlis State Park. Malayan Nature Journal. 2005;57(3):317–326. [Google Scholar]
- Che Salmah MR, Amelia ZS, Abu Hassan A. Preliminary distribution of Ephemeroptera, Plecoptera and Trichoptera (EPT) in Kerian River Basin, Perak, Malaysia. Pertanika Journal of Tropical Agriculture Science. 2001;24(2):101–107. [Google Scholar]
- Che Salmah MR, Abu Hassan A, Jongkar G. Aquatic insect diversities in Kedah, Pinang and Bongor rivers and their potential use as indicator of environmental stress. Proceedings of the National Conference on Rivers’ 99: Towards Sustainable Development in Commemoration of USM’s 30th anniversary; Universiti Sains Malaysia, Pulau Pinang. 14–17 October 1999; Pulau Pinang: Universiti Sains Malaysia; 1999. [Google Scholar]
- De Moor FC, Chutter FM, De Moor IJ. Drift behaviour and microhabitat selection in the preimaginal stages of Simulium chutteri (Diptera Simuliidae) Hydrobiologia. 1986;133(2):143–154. [Google Scholar]
- Downing JA. Aggregation, transformation and the design of benthic sampling programs. Canadian Journal of Fisheries and Aquatic Sciences. 1979;36(12):1454–1463. [Google Scholar]
- Dudgeon D. Tropical stream ecology. Waltham, USA: Academic Press; 2008. [Google Scholar]
- Elliott JM. Effect of temperature on the time of hatching in Baetis rhodani (Ephemeroptera: Baetidae) Oecologia. 1972;9(1):47–51. doi: 10.1007/BF00345242. [DOI] [PubMed] [Google Scholar]
- Gillies CL, Hose GC, Turak E. What do qualitative rapid assessment collections of macroinvertebrates represent? A comparison with extensive quantitative sampling. Environmental Monitoring and Assessment. 2009;149:99–112. doi: 10.1007/s10661-008-0186-9. [DOI] [PubMed] [Google Scholar]
- Hawking JH, New TR. The development of dragonfly larvae (Odonata: Anisoptera) from two streams in north-eastern Victoria, Australia. Hydrobiologia. 1996;317(1):13–30. [Google Scholar]
- Hess AD. New limnological sampling equipment. Limnological Society of America Special Publication. 1941;6:1–5. [Google Scholar]
- Hilsenhoff WL. Rapid field assessment of organic pollution with a family-level biotic index. Journal of the North American Benthological Society. 1988;7(1):65–68. [Google Scholar]
- Hornig CE, Pollard JE. Macroinvertebrate sampling techniques applicable to streams of semi-arid regions, EPA-600/4-78-040. Nevada, USA: Office of Research and Development, Environmental Monitoring and Support Laboratory, USEPA; 1978. [Google Scholar]
- Hughes RM. Rapid bioassessment protocols for use in streams and rivers, benthic macroinvertebrates and fish. Washington DC: Assessment and Watershed Protection Division, USEPA; 1989. [Google Scholar]
- Jäch MA, Ji L. Water beetles of China. Vol. 3. Vienna: Zoologisch-Botanische Gesellschaft and Wiener Coleopterologenverein; 2003. [Google Scholar]
- Jäch MA, Ji L. Water beetles of China. Vol. 2. Vienna: Zoologisch-Botanische Gesellschaft and Wiener Coleopterologenverein; 1998. [Google Scholar]
- Joy M, David B, Lake M. New Zealand freshwater fish sampling protocols: Wadeable rivers and streams. New Zealand: Massey University; 2013. [Google Scholar]
- Kappes H, Haase P. Slow, but steady: Dispersal of freshwater mollusks. Aquatic Science. 2012;74(1):1–14. [Google Scholar]
- Lake M. Freshwater fish: Electrofishing—fixed reach. New Zealand: Department of Conservation Inventory and Monitoring Toolbox; 2013. [Google Scholar]
- Lancaster J, Hildrew AG, Townsend CR. Invertebrate predation on patchy and mobile prey in streams. Journal of Animal Ecology. 1991;60(2):625–641. [Google Scholar]
- Lenat DR. A biotic index for the southeastern United States: Derivation and list of tolerance values, with criteria for assigning water-quality ratings. Journal of the North American Benthological Society. 1993;12(3):279–290. [Google Scholar]
- Mackey AP, Cooling DA, Berrie AD. An evaluation of sampling strategies for qualitative surveys of macro-invertebrates in rivers, using pond nets. Journal of Applied Ecology. 1984;21(2):515–534. [Google Scholar]
- Magurran AE. Measuring biological diversity. Oxford, UK: Blackwell Sciences Ltd; 2004. [Google Scholar]
- Merritt RW, Cummins KW, Berg MB. An introduction to the aquatic insects of North America. 4th ed. Iowa, USA: Kendall/Hunt Publishing Company; 2008. [Google Scholar]
- Merritt RW, Cummins KW. An introduction to the aquatic insects of North America. 3rd ed. Iowa, USA: Kendall/Hunt Publishing Company; 1996. [Google Scholar]
- Morin A. Variability of density estimates and the optimization of sampling programs for stream benthos. Canadian Journal of Fisheries and Aquatic Sciences. 1985;42(9):1530–1534. [Google Scholar]
- Morse JC, Yang L, Tian L. Aquatic insects of China useful for monitoring water quality. Iowa, USA: Kendall/Hunt Publishing Company; 1994. [Google Scholar]
- Needham PR, Usinger RL. Variability in the macrofauna of a single riffle in Prosser Creek, California, as indicated by the Surber sampler. Hilgardia. 1956;24(14):383–489. [Google Scholar]
- Nielsen JL. Scientific sampling effects: Electrofishing California’s endangered fish populations. Fisheries. 1998;23(12):6–12. [Google Scholar]
- Othman MR, Samat A, Hoo LS. The effects of bed-sediment quality on distribution of macrobenthos in Labu River system and selected sites in Langat River, Malaysia. Online Journal of Biological Science. 2002;2(1):32–34. [Google Scholar]
- Peckarsky BL. Habitat selection by stream-dwelling predatory stoneflies. Canadian Journal of Fisheries and Aquatic Sciences. 1991;48(6):1069–1076. [Google Scholar]
- Peckarsky BL, McIntosh AR. Fitness and community consequences of avoiding multiple predators. Oecologia. 1998;113:565–576. doi: 10.1007/s004420050410. [DOI] [PubMed] [Google Scholar]
- Pedigo LP, Buntin GD, Bechinski EJ. Flushing technique and sequential-count plan for green cloverworm (Lepidoptera: Noctuidae) moths in soybeans. Environmental Entomology. 1982;11:1223–1228. [Google Scholar]
- Portt CB, Coker GA, Ming DL, Randall RG. A review of fish sampling methods commonly used in Canadian freshwater habitats. Ontario, Canada: Canadian Technical Reports of Fisheries and Aquatic Sciences; 2006. [Google Scholar]
- Sangpradup N, Boonsoong B. Identification of freshwater invertebrates of the Mekong River and its tributaries. Vientiane: Mekong River Commission; 2006. [Google Scholar]
- Scrimgeour GJ, Culp JM, Glozier NE. An improved technique for sampling lotic invertebrates. Hydrobiologia. 1993;254(2):65–71. [Google Scholar]
- Southwood TRE. Ecological methods with particular reference to the study of insects population. 2nd ed. London: Chapman & Hall; 1978. [Google Scholar]
- Strahler AN. Quantitative analyses of watershed geomorphology. Eos Transactions of American Geophysical Union. 1957;38(6):913–920. [Google Scholar]
- Stark JD. Performance of the Macroinvertebrate Community Index: Effects of sampling method, sample replication, water depth, current velocity, and substratum on index values. New Zealand Journal of Marine and Freshwater Research. 1993;27(4):463–478. [Google Scholar]
- Storey AW, Edward DHD, Gazey P. Surber and kick sampling: A comparison for the assessment of macroinvertebrate community structure in streams of south-western Australia. Hydrobiologia. 1991;211(2):111–121. [Google Scholar]
- Surber EW. Rainbow trout and bottom fauna production in one mile of stream. Transactions of the American Fisheries Society. 1937;66(1):193–202. [Google Scholar]
- Taylor BW, McIntosh AR, Peckarsky BL. Sampling stream invertebrates using electroshocking techniques: Implications for basic and applied research. Canadian Journal of Fisheries and Aquatic Sciences. 2001;58(3):437–445. [Google Scholar]
- Wahizatul AA, Long SH, Ahmad A. Compostion and distribution of aquatic insect communities in relation to water quality in two freshwwater streams of Hulu Terengganu, Terengganu. Journal of Sustainability Science and Management. 2011;6(1):148–155. [Google Scholar]
- Yule CM, Yong HS. Freshwater invertebrates of the Malaysian regions. Kuala Lumpur: Academy of Sciences Malaysia; 2004. [Google Scholar]