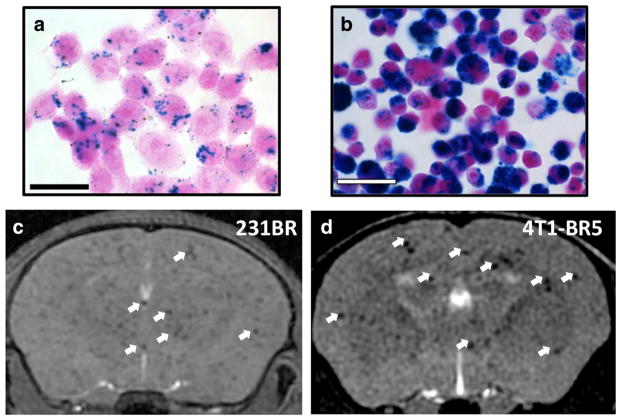
Fig. 1.
Visualization of the delivery of IO-labeled cells to mouse brain by bSSFP MRI. 231BR (a) and 4T1-BR5 (b) cells stained with PPB and counterstained with NFR to detect the presence of iron labeling. Intracellular iron (blue) was detected in the cytoplasm of IO-labeled cells. Representative images are shown. Magnification, ×40; scale bar=30 μm. c Axial MR image of a mouse within 24 h after injection with 1.5×10⁵ IO-labeled 231BR cells. d Axial MR image of mouse within 24 h after injection with 2×10⁴ IO-labeled 4T1-BR5 cells. White arrows indicate examples of signal void

