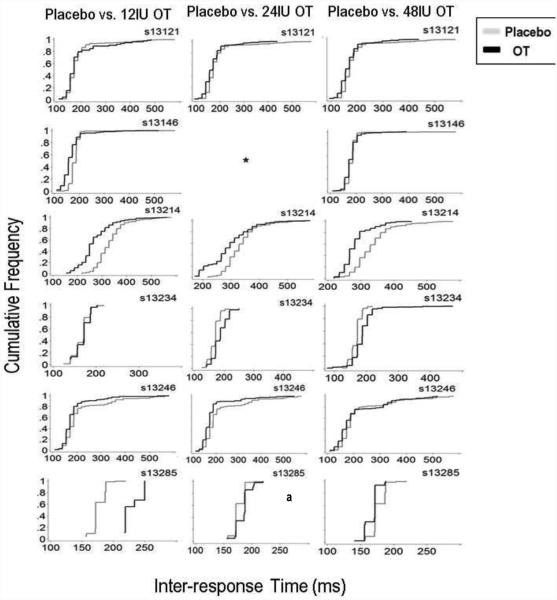
Figure 3.
Data shown are cumulative frequency distributions of IRT data on the aggressive response option across all doses from all participants. Note: different scaling on the x- and y-axes for each individual participant.
* = data lost due to experimenter error. a = session lasted 15min instead of 25min, due to experimenter error.

