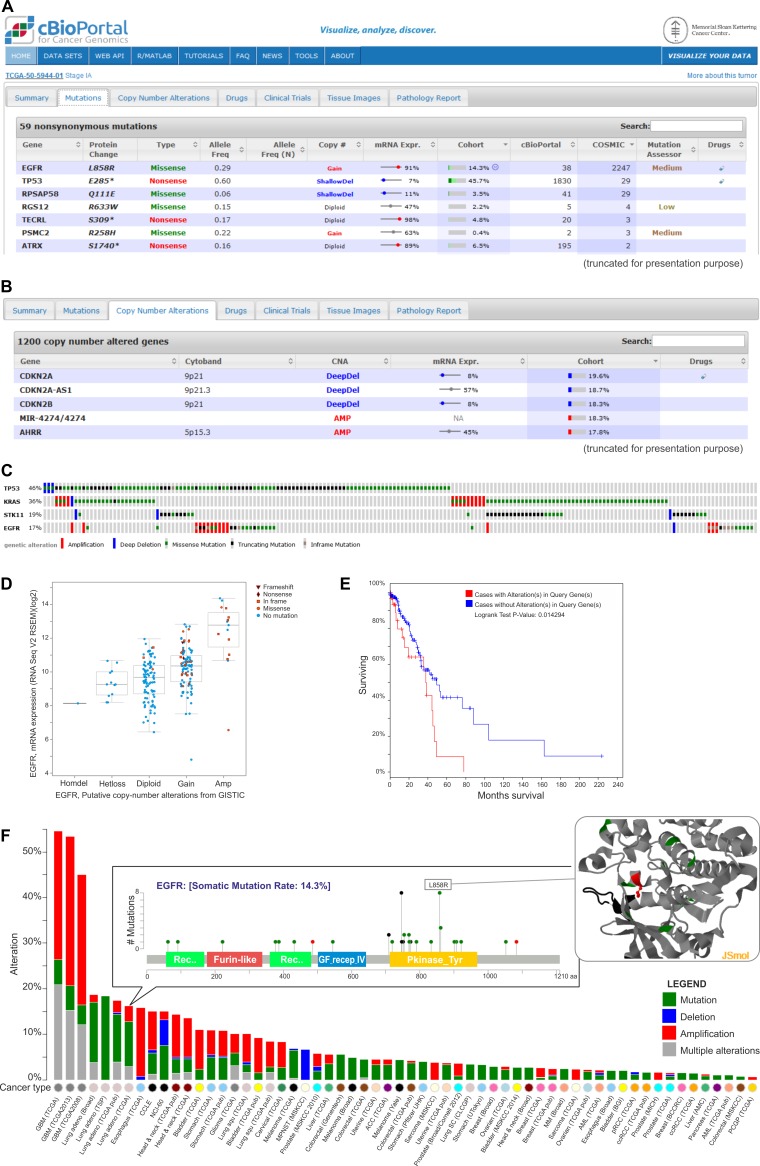
Figure 5. Exemplary data analysis and visualization available in the cBioPortal.
A. The table shows nonsynonymous mutations in the TCGA-50-5944-01 sample of lung adenocarcinoma. They are characterized by the mutation name, its type, its frequency and its effect on the expression of the mutated gene. Additional information on the frequency of specific mutations can be found under the “cBioPortal” and “Cosmic” columns. The table also provides the information about the predictable impact of a given mutation on the gene function (under the Mutation Assessor tool). B. Genes with copy number alterations (CNAs) in the TCGA-50-5944-01 sample are shown. The table also contains the information on the frequency of CNA in a specific gene and the effect of the alterations on the gene expression. C. Summary of the genomic alterations in four selected genes of lung adenocarcinoma samples. Each column shows an individual tumor sample in which homozygous deletions (blue), amplifications (red), missense mutations (green squares), truncating mutations (black squares) and no mutation changes (grey) were found. D. A plot of the correlation between copy number alterations and mRNA expression of the exemplary EGFR gene. E. Kaplan-Meier plot of overall survival shown for patients with (red) and without (blue) changes in EGFR. F. Summary graph of EGFR alterations (shown in different colors) in individual studies deposited in the portal. For a selected study, the distribution of the mutations is shown in the inset. For a selected mutation (here L858R), a 3D interactive protein structure can be displayed (the position of the mutation is indicated in red).

