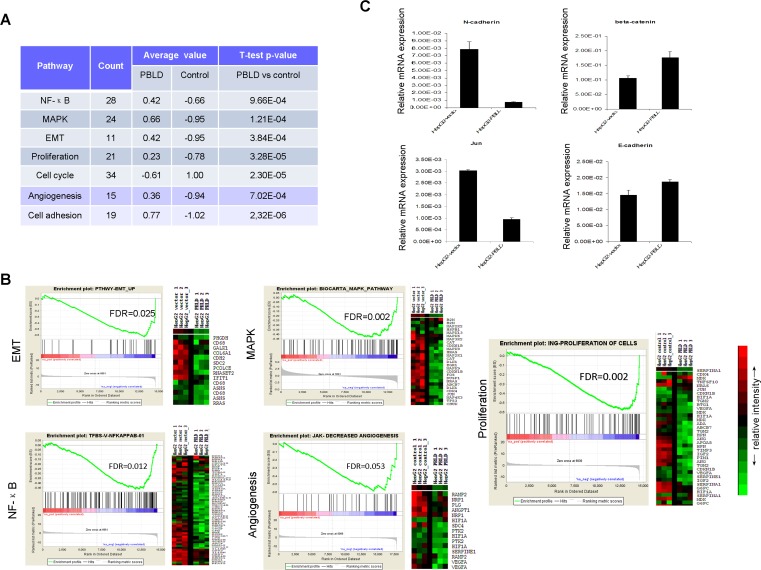
Figure 4. Whole genome microarray analysis of gene expression in HepG2 cells transfected with PBLD_pEGFP-N1 or empty vector.
A. Functional annotation was carried out using gene lists submitted to GSEA and DAVID. B. Expression of MAPK, NF-κB, EMT, angiogenesis and proliferation pathway genes were down-regulated by PBLD overexpression. GSEA results for all fold changes calculated between HepG2_PBLD and control cells were shown on right, and heatmap of significant genes in the each signaling pathway were displayed on left. Red represents high expression levels and green represents low expression levels. C. Gene expression of several marker genes (E-cadherin, β-catenin, JUN, and N-cadherin) was further confirmed by qRT-PCR.

