
Figure 1. Analysis of ZFAS1 expression in CRC tissues and cell lines.
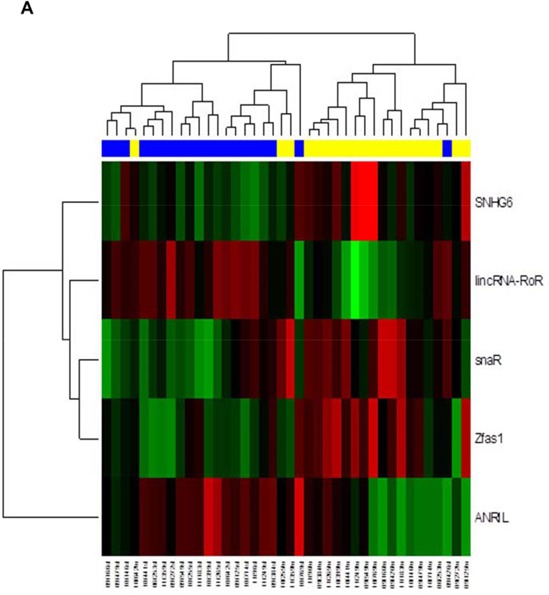
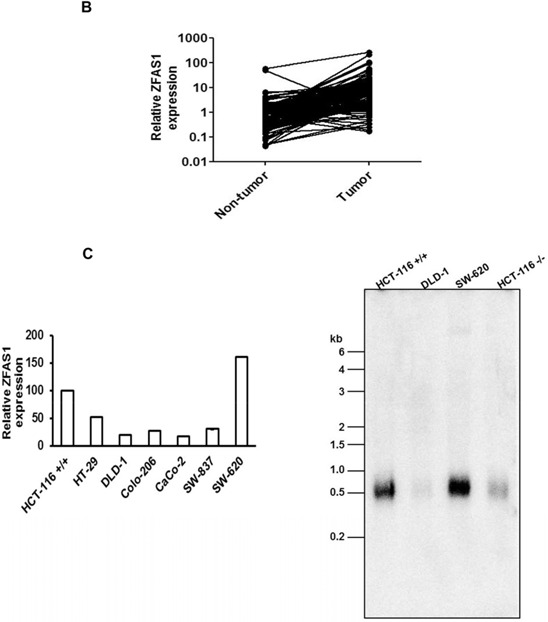
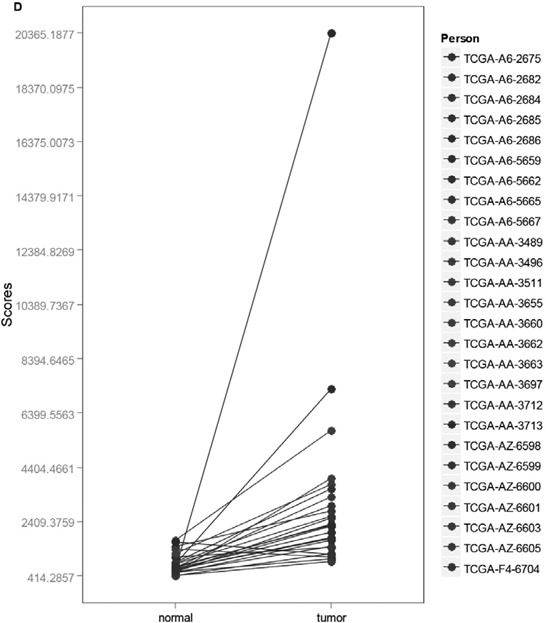
A. Hierarchical clustergram discriminating tumor and non-tumor tissue of CRC patients according to differentially expressed lncRNAs (yellow color indicates tumor samples of CRC patients, blue paired non-tumor colonic tissue, P < 0.01). B. Relative expression of ZFAS1 in CRC tissues (n = 119) compared with corresponding non-tumor tissues (n = 119). ZFAS1 expression was examined by real-time PCR. (P value < 0.001). C. The relative expression level of ZFAS1 in HCT116+/+, HT-29, DLD-1, Colo-206, CaCO-2, SW-837 and SW-620 cells was determined by real-time PCR. (C) The northern blot analysis to measure the ZFAS1 expression in CRC cells HCT116+/+, DLD-1, SW-620 and HCT116−/−. D. Based on the COADREAD, Illumina HiSeq-based TCGA dataset, expression levels of ZFAS1 are significantly higher in CRC tumor tissue in comparison to non-tumor colonic tissue (P < 10−11).