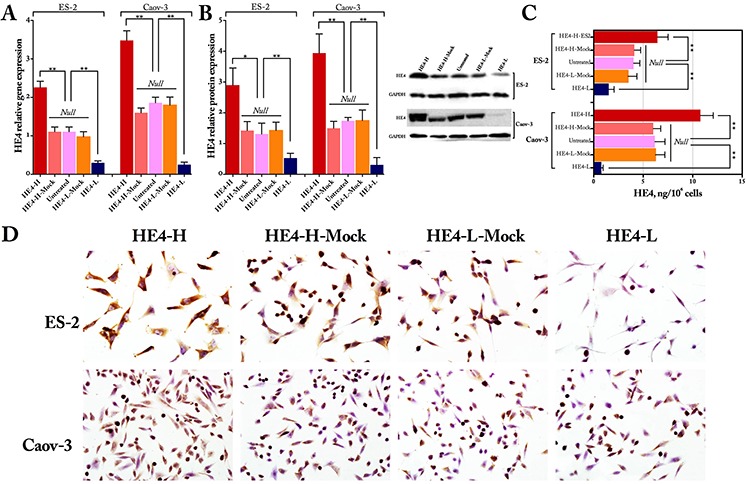
Figure 1. Identification of HE4 gene transfection.

Real time PCR results (panel A) immunoblots staining results (panel B) HE4 concentrations in conditioned media by ELISA (panel C) and immunocytochemistry images (panel D) showed the expression of HE4 after HE4 gene transfection (HE4-H, HE4 gene transfection; HE4-L, HE4 shRNA transfection) in ovarian cancer cell lines ES-2 and Caov-3, in which panels A and B are quantitative expressed as HE4 relative to GAPDH and the Western blotting image in panel B and ICC images in panel C are partly from Zhuang, H., et al., Mol Cancer, 2014. 13:p243.
