
Figure 6. Interaction network of the differentially expressed genes in MAPK, ECM-receptor interaction and cell cycle pathways.
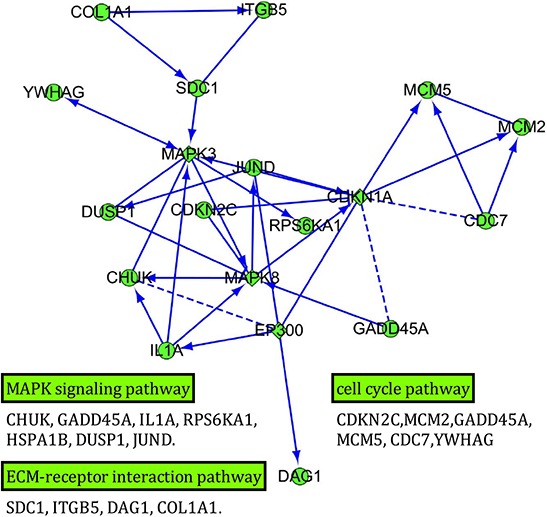
Genes with more links are shown in bigger size. The square represents the predicted genes. Arrow line represents definite control relationship, dotted line represents predicted control relationship, and solid line represents inhibition.