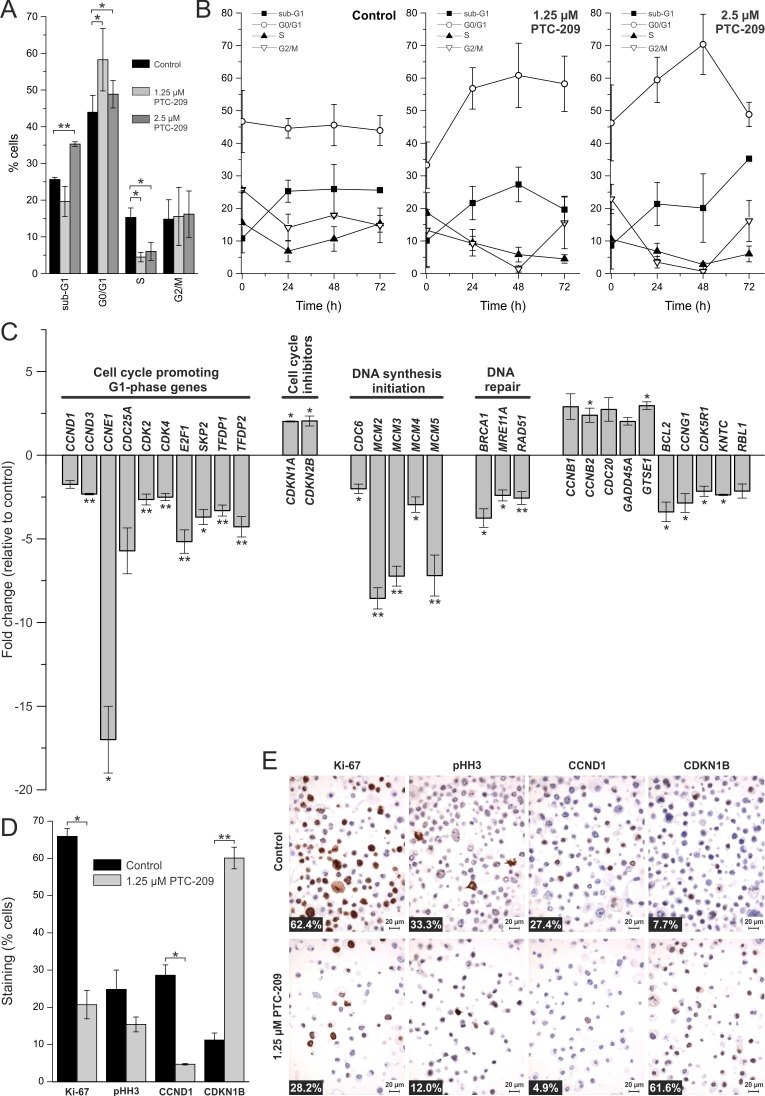
Figure 3. Effects of PTC-209 on the cell cycle.
A. Cell cycle distribution of PTC-209 treated GBC cells compared to untreated cells after 72 h (n = 4). B. Time-dependent effect of PTC-209 on the cell cycle distribution of GBC cells (n = 4). Sub-G1 represents cells with a DNA content less than 2N, G0/G1 cells with DNA content 2N, S cells with DNA content greater than 2N and G2/M cells with DNA content 4N. C. Changes in expression of cell cycle relevant genes after 24 h of 1.25 μM PTC-209 treatment (n = 4). Data were normalized to five housekeeping genes (BETA-ACTIN, B2M, GAPDH, HPRT1 and RPLP0) according to the manufacturer's suggestion (Qiagen Data Analysis Center) and related to untreated controls. For full gene names and Refseq number see additional file 4. D. Quantitative analysis of immunostaining of GBC cells for Ki-67, pHH3, CCND1 and CDKN1B after 72 h (n = 3). E. Representative images of immunostaining of GBC cells. Numbers at bottom left corner indicate percentage of positive cells. Asterisks indicate significant (*, p<0.05) or highly significant (**, p<0.01) differences related to untreated control cells. Abbreviations: h: hours.

