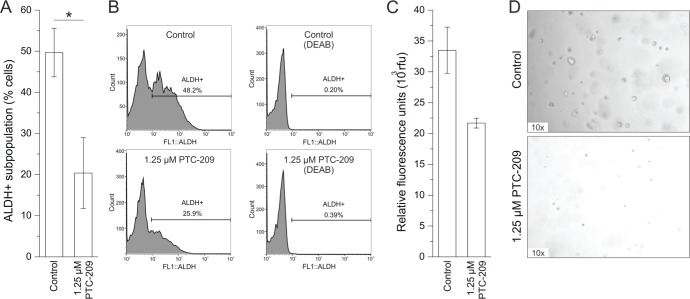
Figure 4. PTC-209 reduces functional stem cell characteristics.
A. Reduction of the ALDH+ subpopulation in GBC cells after 72 h of 1.25 μM PTC-209 treatment (n = 5). B. Example histograms for untreated and PTC-209 treated GBC cells (left) with corresponding negative DEAB controls (right). C. Reduction of sphere formation of GBC cells after 14 days of 1.25 μM PTC-209 treatment (n = 4). D. Representative images of sphere formation of GBC cells after 14 days. Asterisks indicate significant (*, p<0.05) differences related to untreated control cells. Abbreviations: ALDH+: aldehyde dehydrogenase-1 positive cells; DEAB: N,N-diethylaminobenzaldehyde; h: hours.

