
Figure 2. Knockdown of linc-POU3F3 levels in CRC cells.
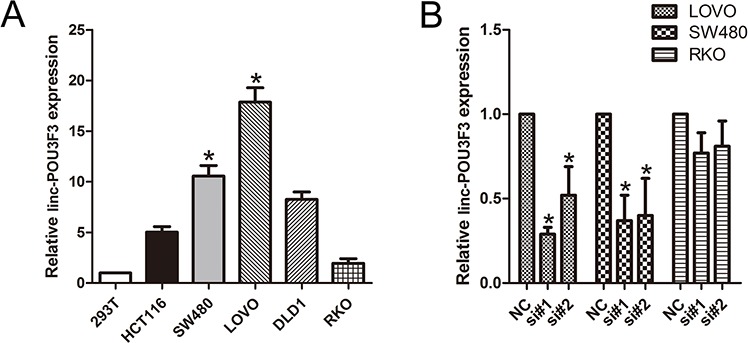
A. QPCR analysis to examine the expression levels of linc-POU3F3 in various CRC cell lines (HCT-116, SW480, LOVO, DLD-1, and RKO) and in HEK293T cells (Mean ± SD, n = 3; *P < 0.05 vs. 293T). B. The knockdown efficiency in LOVO, SW480, and RKO cells by transfected si-linc-POU3F3 (NC, control siRNA; Mean ± SD, n = 3; *P < 0.05 vs. NC).