
Figure 6. 25D3 induces target gene transcription despite marked reduction in CYP27B1 expression.
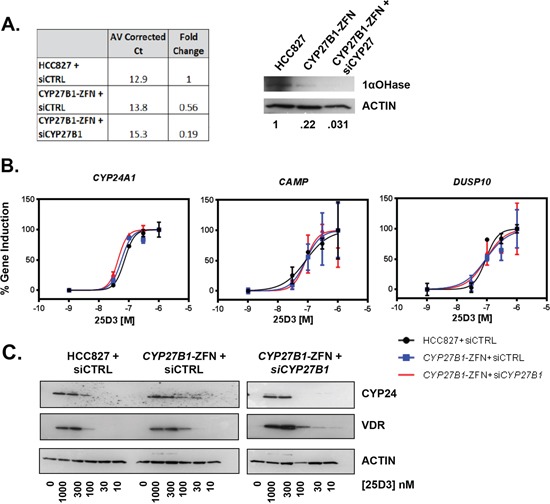
A. CYP27B1 mRNA (left panel) and 1αOHase (right panel) expression was compared 24 h post-transfection of siCTRL into HCC827 and CYP27B1-ZFN cells or CYP27B1 siRNA into CYP27B1-ZFN cells. For mRNA expression data, average corrected Ct values were calculated by subtracting the GAPDH Ct from the CYP27B1 Ct value. Fold-change was calculated using the 2-ΔΔCt method. B. VDR target gene expression was studied in cells transfected with siRNA for 24 h and then treated with the indicated concentrations of 25D3 for 6 h. qRT-PCR was performed to quantify gene induction. Dose response curves were created in GraphPad Prism. Error bars represent standard error of the mean for triplicate samples within a single experiment. C. Induction of VDR and CYP24 protein was examined by Western blot (15 μg total protein per lane). Cells were transfected with siRNA for 24 h and then treated with 25D3 for 6 h. CYP27B1-ZFN+ siCYP27B1 samples were run concurrent with siCTRL-transfected cells but were on a separate gel. All gels were exposed for the same amount of time.