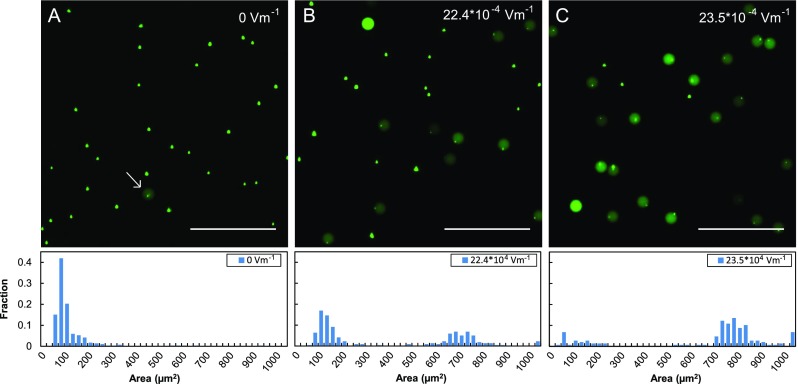
FIG. 2.
Example of the effects of electrical lysis on encapsulated E. coli cells expressing GFP. Green fluorescence pictures of the cells taken when (a) no electric field was applied, (b) 22.4 × 10⁴ V m−1 was applied, and (c) 23.5 × 10⁴ V m−1 was applied. As the electric field increases, the fraction of lysed cells increases, which is quantitatively shown in the histogram below the image. The scale bar in the images represents 100 μm.

