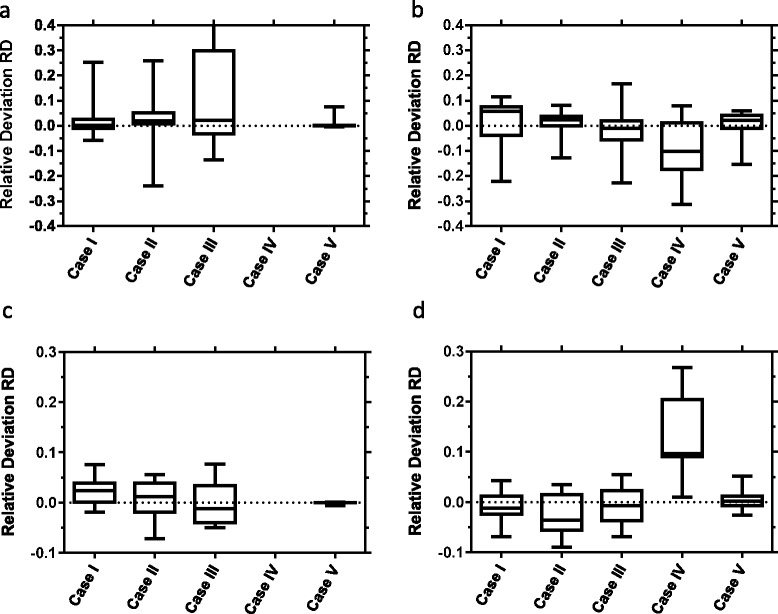
Fig. 3.

Box plot showing median, 25 and 75 % quartiles, min and max of the RD of AUC estimation for the best case (least RD) and the reference data set for the tumor (a, b) and kidneys (c, d) indicating mean and standard deviation. Left panels show the results for the standard approach (a, c). Note that for case IV, the number of available data points is smaller than the number of fit parameters. Therefore, a fit could not be performed. Right panels (b, d) show the corresponding results for the iterative approach. Cases I–IV represent omitting 1, 2, 3, or 4 organ and serum measurements; case V represents omitting all eight serum measurements
