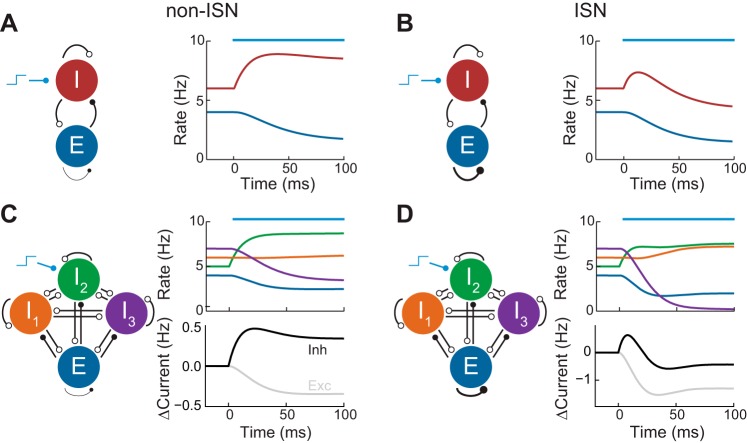
Fig. 1.
Inhibition stabilized networks (ISNs) and non-ISNs. A, left: schematic of non-ISN with excitatory (E) and inhibitory (I) populations. Open circles represent inhibitory synapses while closed circles represent excitatory synapses. Right: E and I population firing rates in response to a stimulus applied to the I population (blue bar). B: same as A but for an ISN in which the EE connection is strong. C, left: schematic of non-ISN with 3 inhibitory populations. Right: population firing rates and change in magnitude of the total excitatory and inhibitory currents received by the excitatory population in response to a stimulus applied to population I2 (blue bar). D: same as C but for an ISN.

