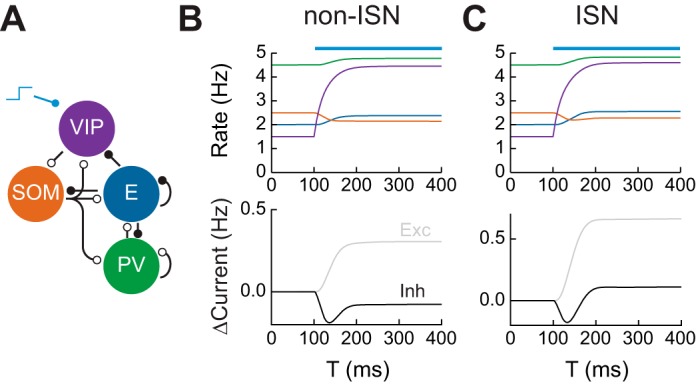
Fig. 2.

Connectivity in mouse V1 and disinhibition. A: connectivity between neuronal subtypes in mouse V1. Open circles represent inhibitory synapses while closed circles represent excitatory synapses. SOM, somatostatin; PV, parvalbumin. B, top: firing rates of neuronal subpopulations in a non-ISN in response to activation of vasointestinal peptide (VIP)-expressing interneurons at T = 100 ms. Bottom: change in magnitude of total excitatory and inhibitory currents received by the excitatory subpopulation. C: same as B for an ISN.
