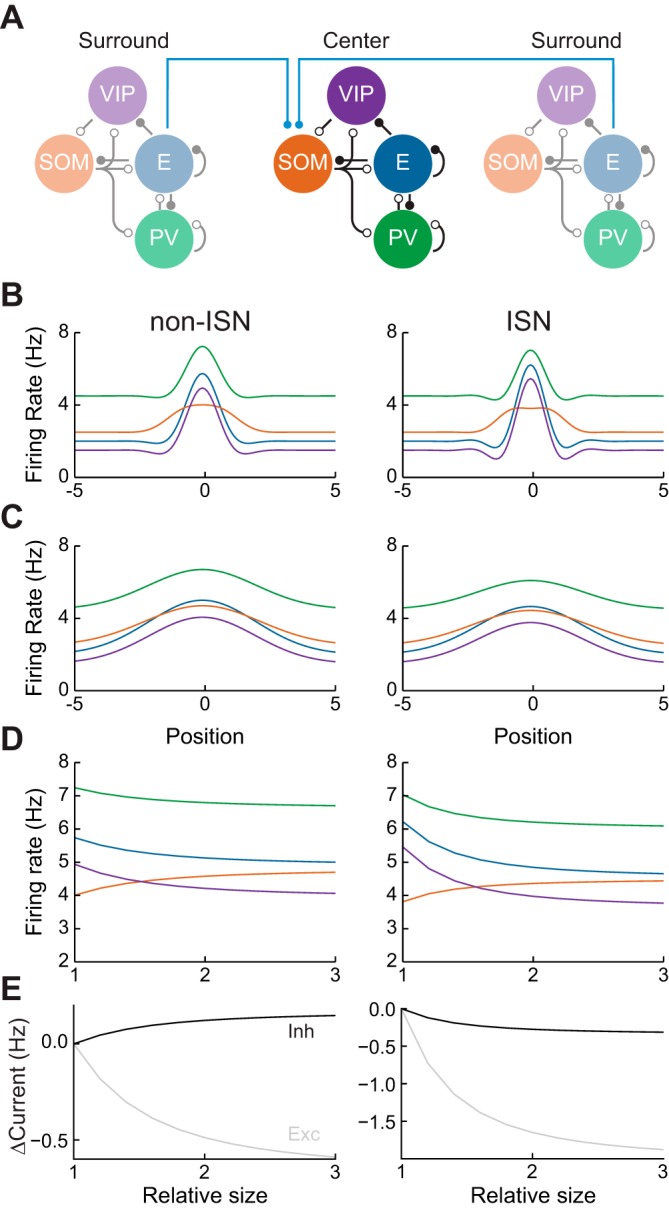
Fig. 3.

Dynamics of surround suppression. A: surround suppression circuit. Local networks as in Fig. 2 interact via long-range projections from excitatory subpopulations to SOM subpopulations (blue lines). B: firing rates of each subpopulation as a function of distance from stimulus center, when a center stimulus is presented. C: same as B for a center + surround stimulus. D: firing rates of each neuronal subtype at the stimulus center, as a function of relative stimulus size. E: change in magnitude of total excitatory and inhibitory currents received by excitatory neurons at the stimulus center.
