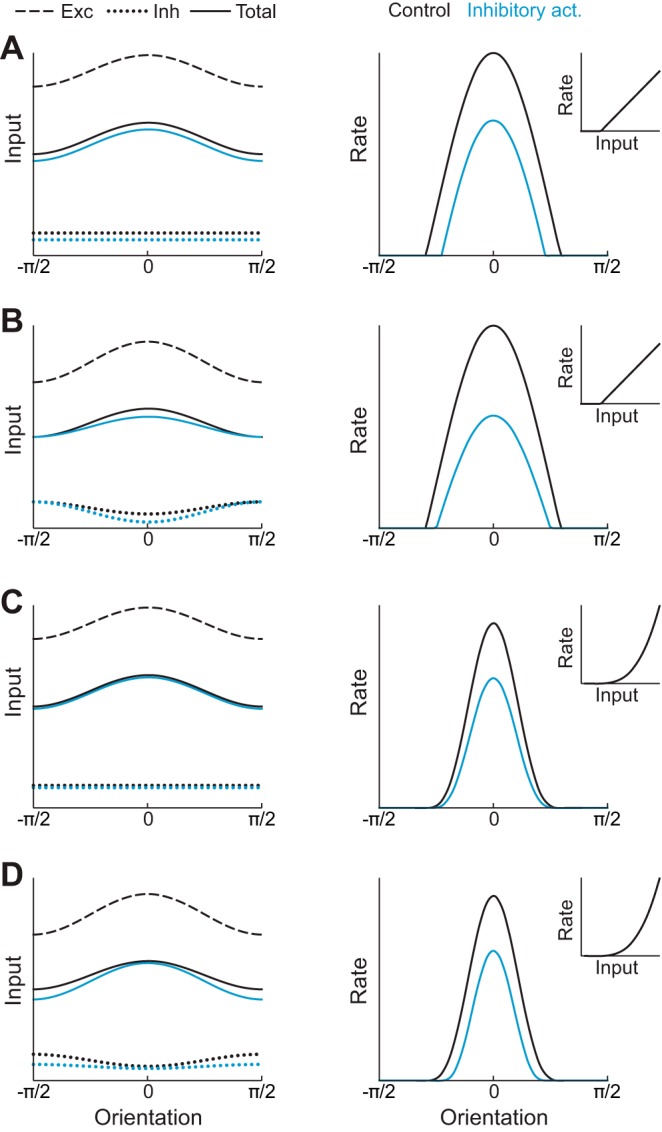
Fig. 4.

Possible mechanisms of division and subtraction. A, left: schematic of excitatory (dashed) and inhibitory (dotted) inputs to an E neuron and their sum (solid) as a function of orientation. Activation of inhibitory neurons increases untuned inhibition, reducing the total input (blue curves). Right: E neuron tuning curve, calculated by applying a threshold-linear function (inset) to the total input on the left. Activation of inhibitory neurons leads to subtraction of the tuning curve (blue line). B: similar to A, but with a power-law transfer function, leading to approximate division of the tuning curve. C: similar to A, but with inhibition whose tuning increases during activation, leading to approximate division of the tuning curve. D: similar to A, but with a power-law transfer function and inhibition whose tuning is reduced during activation. The total subthreshold input is both reduced and sharpened, leading to approximate subtraction of the tuning curve.
