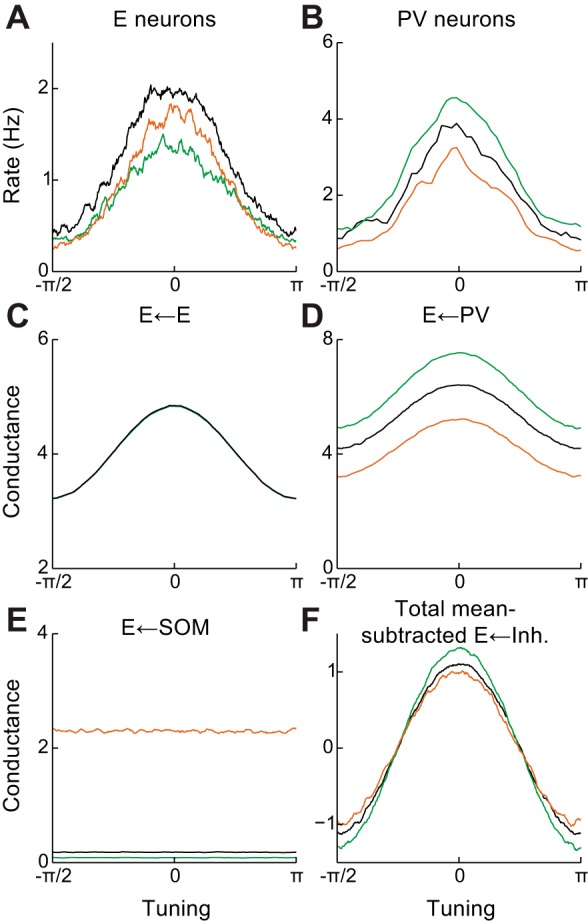
Fig. 6.

Modulation of pyramidal neuron tuning curves by inhibitory activation in a network with tuned PV neurons. A: excitatory neuron tuning curves in control and PV/SOM-activated states. B: same as A for PV neurons. C: tuning of excitatory conductance onto excitatory neurons. D: same as C but for PV neuron conductance. E: same as C but for SOM neuron conductance. F: tuning of total inhibitory conductance onto excitatory neurons, showing decreased tuning of inhibition during SOM activation. Green, PV neuron activation; orange, SOM neuron activation.
