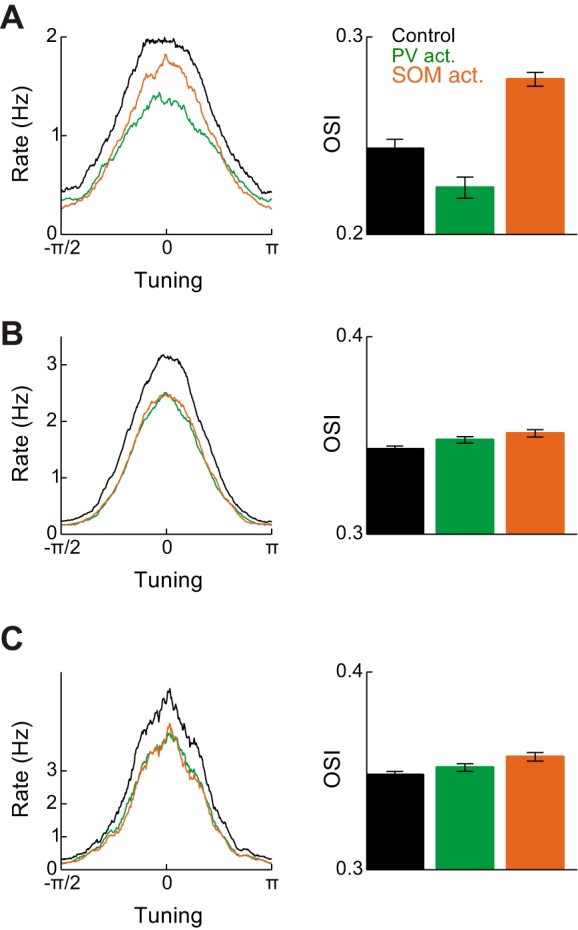
Fig. 7.

Orientation selectivity in different networks. A, left: excitatory neuron tuning curves in control, PV neuron activation, and SOM neuron activation conditions, for the network in Fig. 6. Right: orientation selectivity index (OSI) in the 3 conditions. B: same as A for a network without tuned PV neurons. C: Same as B for a network in which excitatory neurons were modeled with 2 compartments.
