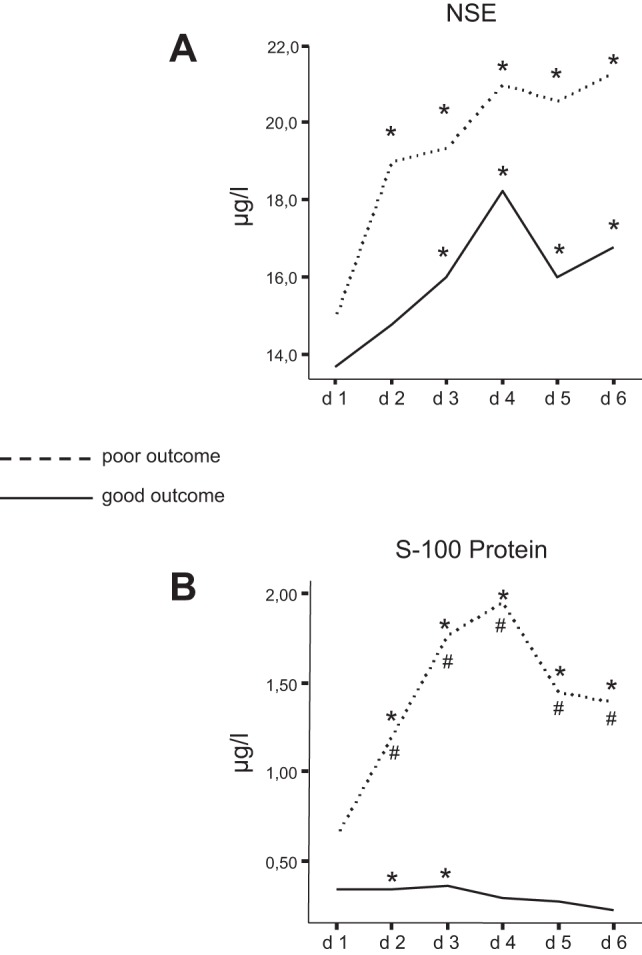
Fig. 3.

A: comparison of mean neuron-specific enolase (NSE) values between the 2 outcome groups. NSE values increased over time in both groups and were generally higher in the group with poor outcome, but the difference between the groups did not reach statistical significance. *Statistically different from control group (P < 0.05). B: comparison of mean S100 protein values between the 2 outcome groups. S100 values were significantly higher in the group with poor outcome and peaked at day 4 (d 4). In contrast, S100 values were stable and did not increase over time in the group with good outcome. *Significantly different from control group (P < 0.05); #significant difference between outcome groups (P < 0.05).
