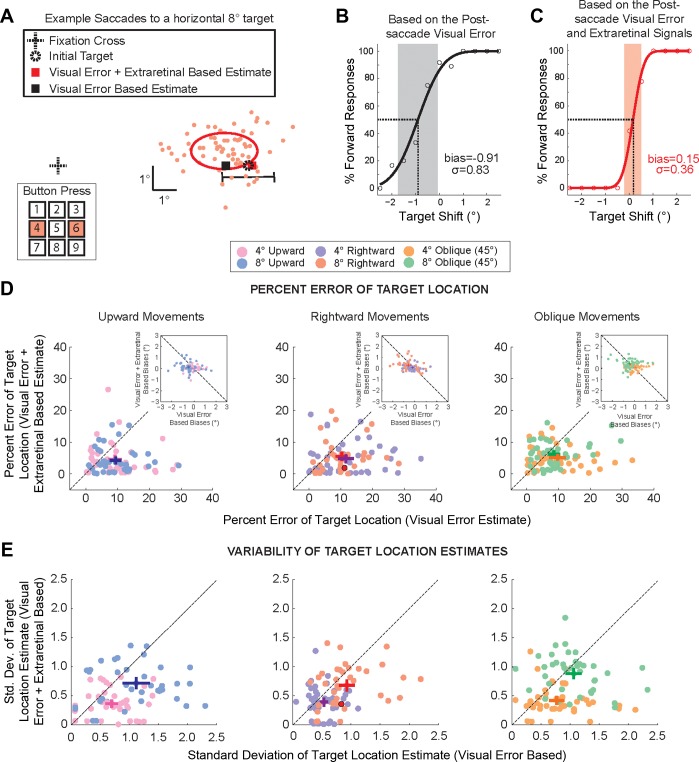
Fig. 5.
Comparison of the postsaccadic target location estimation based solely on postsaccade visual information or with additional extraretinal information. A: eye movements of an example subject for saccades to a rightward target at 8°. Primary saccade end points are displayed as filled red circles. The initial target is marked by a dashed circle, and the solid ellipse represents the spatial extent of the 1 SD confidence interval of saccade end-point variability. The black horizontal line marks the range (±2.5° of displacement) of the target shift. Subjects were required to report the direction of the perceived target shift by pressing numbers on a keypad, in this example either the 4 or the 6 for the horizontal displacement direction. Red and black squares represent the perceptual (Visual Error + Extraretinal based) and Visual Error-based estimates of the target location, respectively. B and C: Visual Error-based (B) and Visual Error + Extraretinal-based (C) psychometric functions of perceived target displacement. Cumulative Gaussian distributions are plotted for both Visual Error + Extraretinal-based and Visual Error-based judgments of shift direction. Shaded regions represent the respective 1 SD range, and dashed lines indicate the perceptual bias; the corresponding values are given in each plot. D: individual data points (light filled circles) and average (dark filled symbols) % errors of target location (Visual Error + Extraretinal- vs. Visual Error-based estimates) are plotted for each target amplitude and direction (rightward 4°, purple; rightward 8°, red; oblique 4°, orange; oblique 8°, green; upward 4°, pink; upward 8°, blue). Crosses represent respective means and SE across subjects. Insets compare the respective Visual Error + Extraretinal-based and Visual Error-based bias measures. E: SD of target location estimates. Individual data points (light filled circles) and average (dark filled symbols) SDs of target location (Visual Error + Extraretinal- vs. Visual Error-based estimates) are plotted for each amplitude and direction. Crosses represent means and SE across subjects. Data for the example subject in A–C are represented by the red filled circle in D and E, center.

