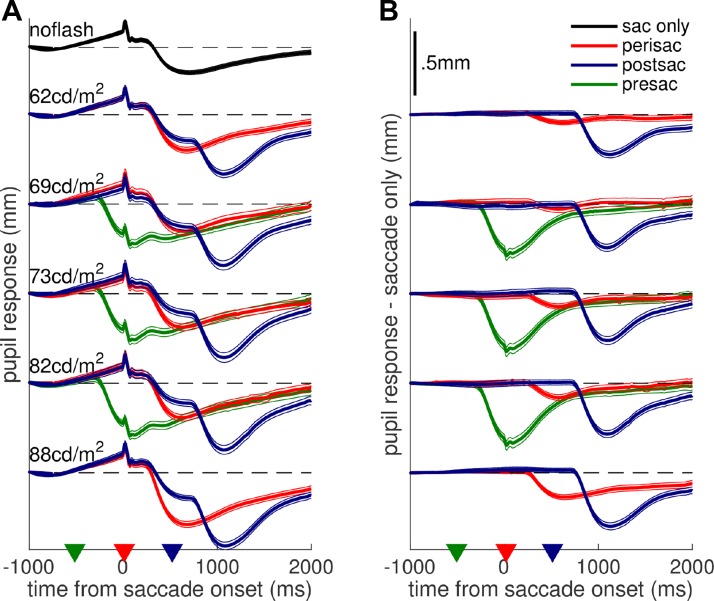
Fig. 2.
Pupillary traces. Pupil size change as a function of time from saccade onset, plotted separately for trials in which the flash occurred before/during/after the saccade or was withheld (different colors) and for the different luminance levels of the flash (y-offset; luminance as shown). Traces are averages across all trials from all subjects (with thin lines giving 95% confidence intervals), computed after subtracting from each trial the mean pupil size in the first 500 ms (A) and subtracting the average pupil trace in the saccade-only condition from each subject and experimental session (B). Black dashed lines mark 0 for each group of traces; triangles in x-axis mark the time of flash presentation. Scale is the same in A and B (shown in B, top).

