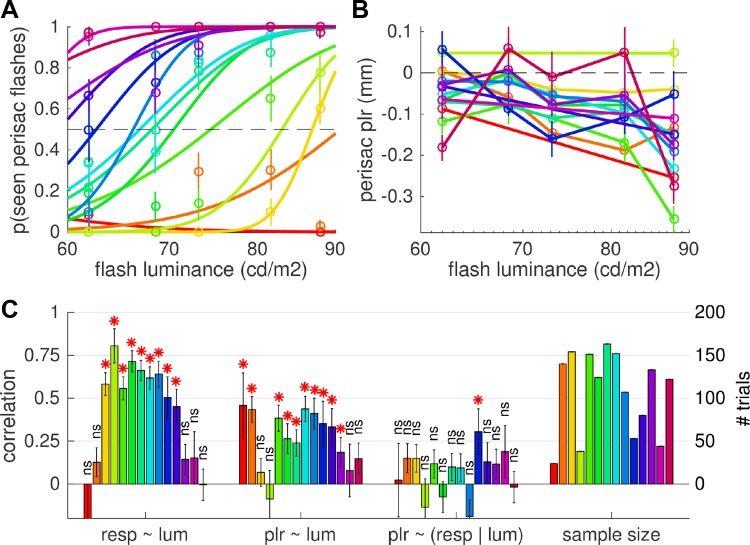
Fig. 5.
Responses to perisaccadic seen and unseen flashes. A: individual psychometric curves plotting, for each subject (color-coded, preserved across the 3 panels), the proportion of seen perisaccadic flashes against their luminance (symbols with error bars showing SE across trials) and the best-fit cumulative Gaussian function across the data. B: pupillary response to perisaccadic flashes (computed as in Fig. 3B). C: Spearman rank correlation between luminance of the flash and the seen/unseen report or the amplitude of the pupillary response (significant for most subjects; *P < 0.05), and partial correlation between the seen/unseen report and the pupillary response after controlling for the effect of luminance [nonsignificant (ns) with P > 0.05 in all but 1 subject]. Bars on right display the number of trials considered for these correlations. Error bars report SE of the correlation coefficient, computed as SE = √[(1 − r2)/(n − 2)].

