
Fig. 5.
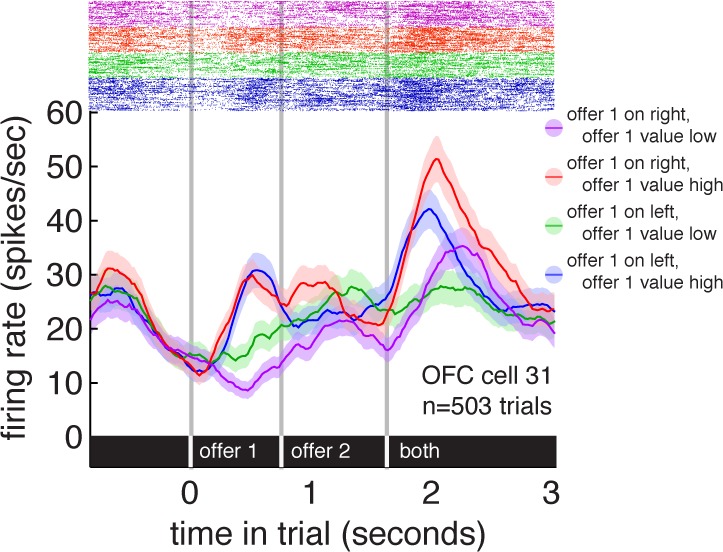
Raster plot and average responses (±1 SE in firing rate) of an example OFC neuron to task events, separated by offer 1 side and offer 1 expected value. This neuron responded to both the value of offer 1 and its side of presentation.
Official websites use .gov
A
.gov website belongs to an official
government organization in the United States.
Secure .gov websites use HTTPS
A lock (
) or https:// means you've safely
connected to the .gov website. Share sensitive
information only on official, secure websites.
Raster plot and average responses (±1 SE in firing rate) of an example OFC neuron to task events, separated by offer 1 side and offer 1 expected value. This neuron responded to both the value of offer 1 and its side of presentation.