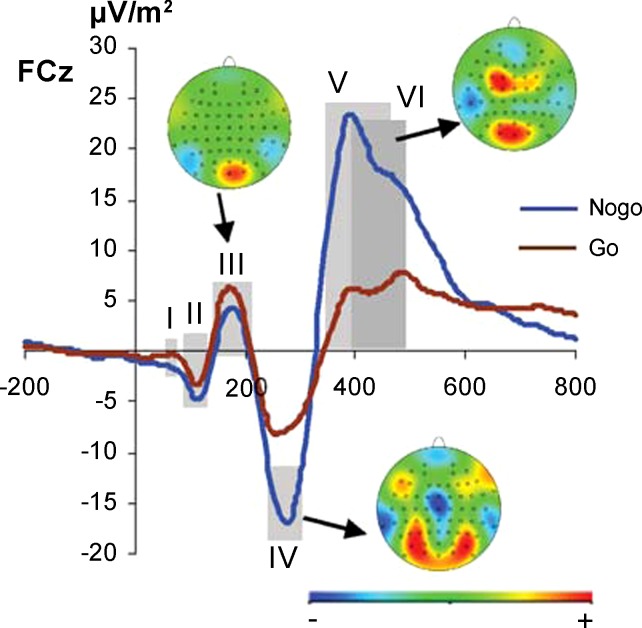
Fig. 1.
Illustration shows the mean potentials for n = 262 on Nogo (blue) and Go trials (brown) at electrode FCz including scalp topography maps. In the scalp topography plots, red colors denote positivity and blue colors negativity. Gray shadings show the different time bins used for data extraction for standard event-related potential (ERP) analysis and the data-driven analysis to predict performance on a single-subject level. Note that time bins V and VI overlap.

