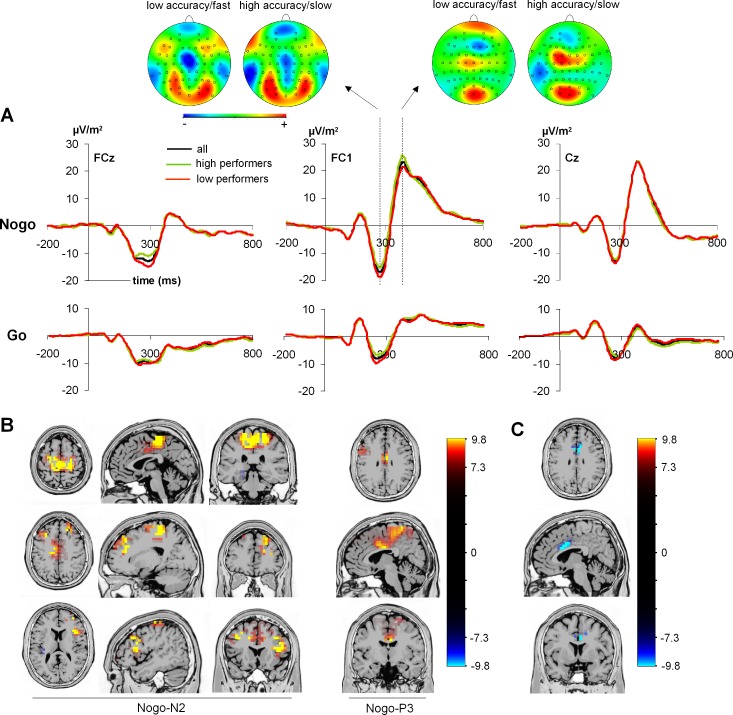
Fig. 3.
A: ERPs on Go and Nogo trials shown for the entire sample (all) as well as the high- and low-performance groups. Scalp topography plots show the Nogo-N2 and the Nogo-P3 for the high- and low-performance groups. In the scalp topography plots, red colors denote positivity and blue colors negativity. B: results from sLORETA analysis contrasting Go against Nogo trials (Nogo > Go) in the entire sample for the (Nogo)-N2 time window (left) and the (Nogo)-P3 time window (right). C: results from sLORETA analysis of Nogo trials between high and low performers in the N2 time window (accurate/slow < less accurate/fast).

