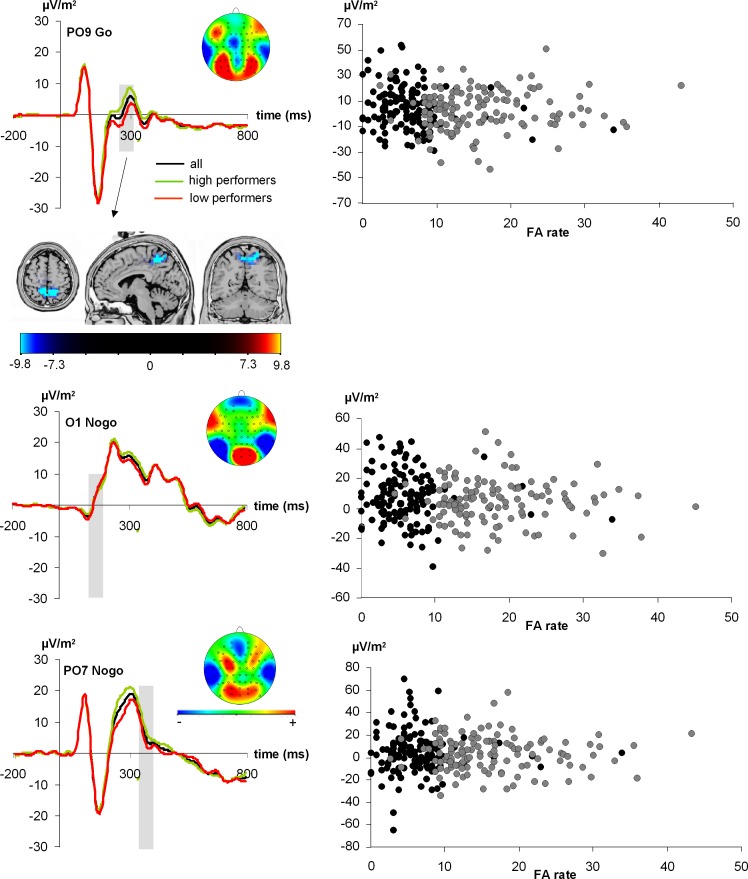
Fig. 4.
ERPs shown for the different features that best predicted task performance on a single-subject level. The entire sample as well as the high- and low performance groups are shown. Top: the extracted feature shows the P2 on Go trials. The sLORETA analysis contrasting the amplitude of the P2 on Go trials between high and low performers (accurate/slow < less accurate/fast) revealed a source in the precuneus (BA7). Middle and bottom: the other 2 extracted features. In all panels, gray shading shows the time bins that best predicted performance on a single-subject level. The scalp topography plot is also shown for these time bins. In the scalp topography plots, red colors show positivity and blue colors negativity. Right: scatterplots for the extracted feature as a function of the false alarm (FA) rate. Black dots denote the “accurate/slow” group and gray dots the “less accurate/fast” group.

