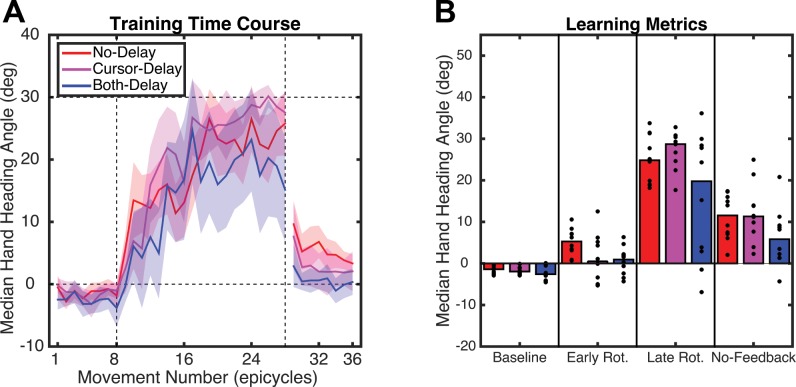
Fig. 2.
A: hand heading angle over the course of experiment 1. Hand angles were binned into trials of 8 (epicycle) for each participant and then combined across participants. Median (solid line) and 95% confidence interval for the No-Delay, Cursor-Delay, and Both-Delay conditions are shown. The rotation was present between the 2 vertical dashed lines. B: hand heading angle during the baseline, early, and late phases of the Rotation block and the first epicycle of the Washout block. Bar graphs indicate median values and dots individual participants. Colors as in A.

