
Fig. 4.
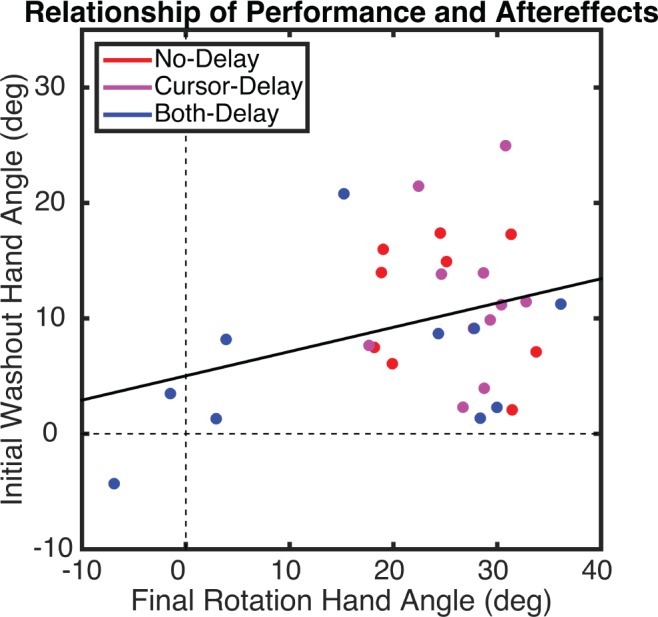
Experiment 1: relationship between mean hand angle during final epicycle in the Rotation block and first epicycle of the Washout block (i.e., aftereffect), calculated across all participants. Dots represent individual participants, with colors indicating group membership, and the solid line represents the regression.