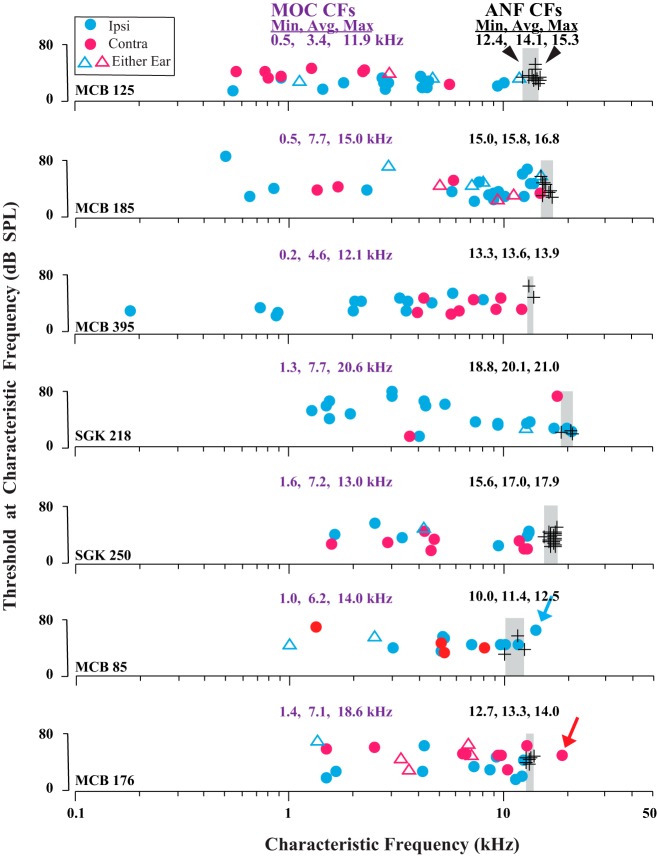
Fig. 2.
Data illustrating that MOC CFs (colored symbols) are distributed in a broad pattern up to an upper limit, or edge, at the CF of ANFs (black symbols). Data are from 7 individual guinea pigs; CF minimums, averages, and maximums (Min, Avg, Max) are given for each animal. For ANFs, the narrow range of CFs (gray shading) differs from case to case because of differences in placement of the recording site in each cochlea. The guinea pigs in the 2 lowermost plots had exceptional MOC units with CFs above those of ANFs (colored arrows). Ipsi units are driven by sound in the ipsilateral ear, contra units by sound in the contralateral ear, and either-ear units by sound in either ear.

