
Fig. 3.
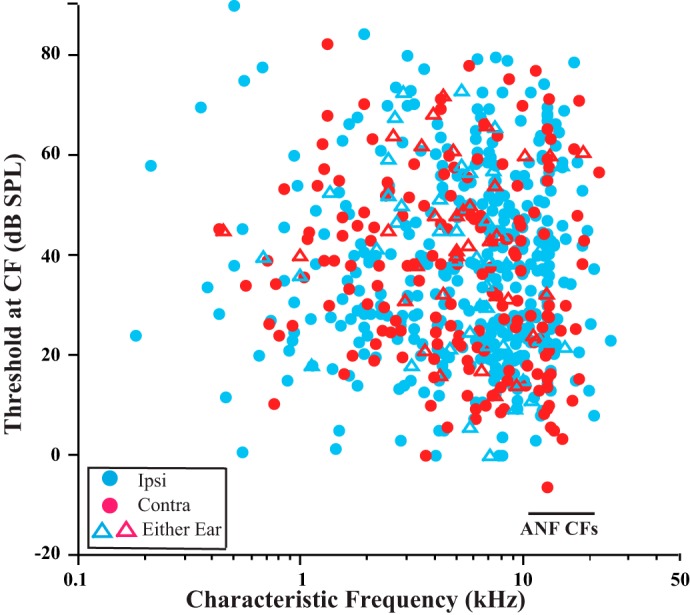
Pooled distribution of CFs of all MOC units. Data are 639 MOC units from 133 guinea pigs. Horizontal bar indicates the overall range for CFs of ANFs (9.64 to 22.6 kHz).
Official websites use .gov
A
.gov website belongs to an official
government organization in the United States.
Secure .gov websites use HTTPS
A lock (
) or https:// means you've safely
connected to the .gov website. Share sensitive
information only on official, secure websites.
Pooled distribution of CFs of all MOC units. Data are 639 MOC units from 133 guinea pigs. Horizontal bar indicates the overall range for CFs of ANFs (9.64 to 22.6 kHz).