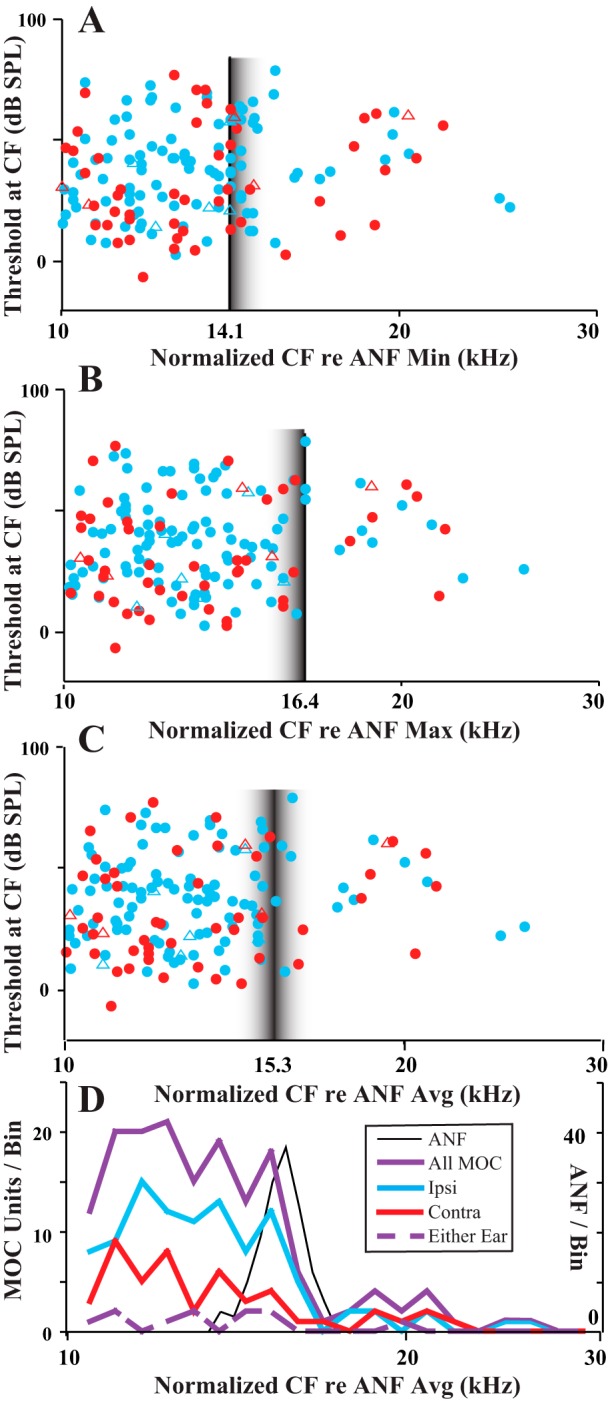
Fig. 4.

Normalized MOC data to allow for comparisons of the CF edge of all units across preparations. Normalization was done for each particular guinea pig according to 3 measures of the CFs of ANFs in that guinea pig. A: CFs multiplied by 14.1/(ANF CFmin), where ANF CFmin is the minimum CF of the ANF from the preparation in which the MOC unit was recorded. B: CFs multiplied by 16.4/(ANF CFmax), where ANF CFmax is the maximum CF of the ANF from the preparation. C: CFs multiplied by 15.3/(ANF CFavg), where ANF CFavg is the average CF of the ANF from the preparation. The multipliers (14.1, 16.4, or 15.3) were chosen because they are the average minimum CF, average maximum CF, and average CF (in kHz) across the preparations of the study. Vertical lines indicate the points of alignment based on ANF measures, and fuzzy borders are meant to indicate nonalignment of ANF CFs there. D: binned data using average normalized MOC CFs (same x-axis as C) and ANF data consisting of 145 units from the 12 guinea pigs in which 8 or more ANFs were recorded.
