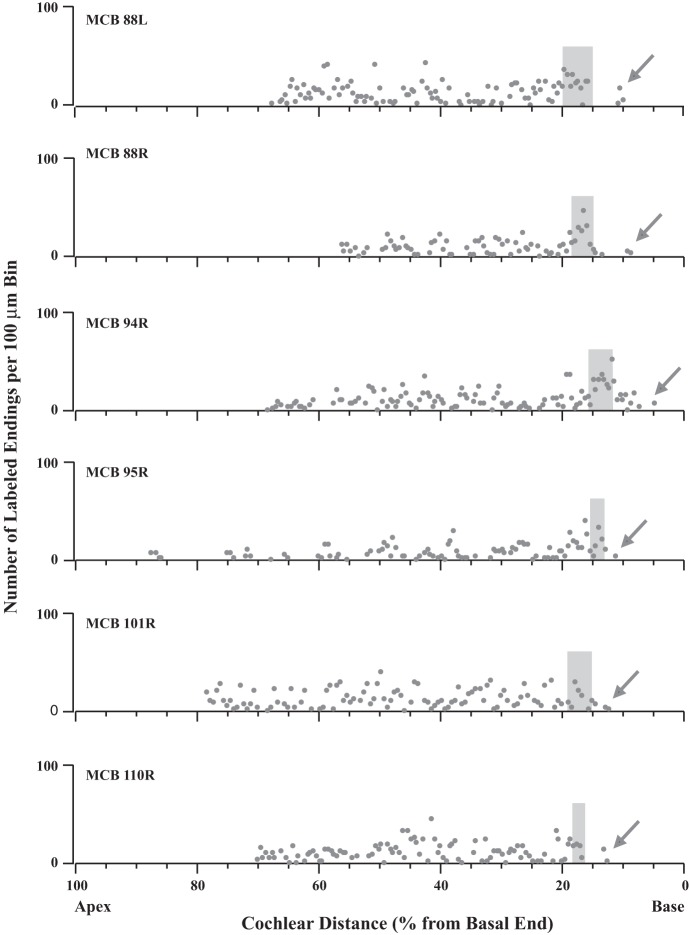
Fig. 7.
Data illustrating that MOC labeling is distributed in a broad pattern approaching a basal limit, or edge, where it drops off at the position of the labeling of ANFs (gray shading). Each graph shows the labeling in an individual cochlea. Points represent the number of MOC endings in 100-μm bins; bins with no endings are not plotted. Arrows indicate MOC labeling more basal than the ANF labeling. Survival times were the longest of the present data set to ensure the most apical labeling and are (from top to bottom) 23.5, 22.5, 13.25, 24, 24, and 12 h. Case 94R was illustrated in Fig. 6B.

