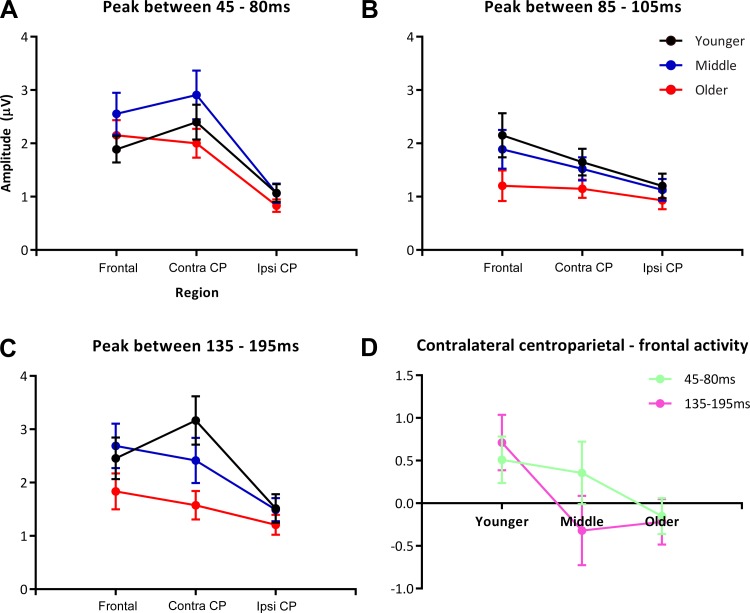
Fig. 4.
A–C: graphs depicting absolute SEP amplitude at each region, separated by age. A: 45–80 ms. Note the increased amplitude response in the middle age group compared with the younger and older age groups at both the frontal and contralateral centroparietal regions. B: 85–105 ms. Graph depicts the relative similarity in response amplitude for the younger and middle age groups and the reduced response for the older age group. C: 135–195 ms. There is a clear stratification by age in the last window of analysis, with the younger group showing the greatest activity in the contralateral parietal region and the older group showing the lowest amplitude response. D: graph of the difference in amplitude between more posterior vs. more anterior regions of interest. For the early time window (45–80 ms) there is a relatively linear trajectory with age, representing activity weighted toward the more posterior region in the younger group, vs. relatively equal activity across the anterior and posterior regions of activation foci in the older group. For the 135–195 ms time period, the younger group shows this same differential weighting toward the posterior region, whereas the middle and older groups have responses that are slightly weighted toward the anterior region of the activation foci. CP, centroparietal; contra, contralateral; ipsi, ipsilateral.

