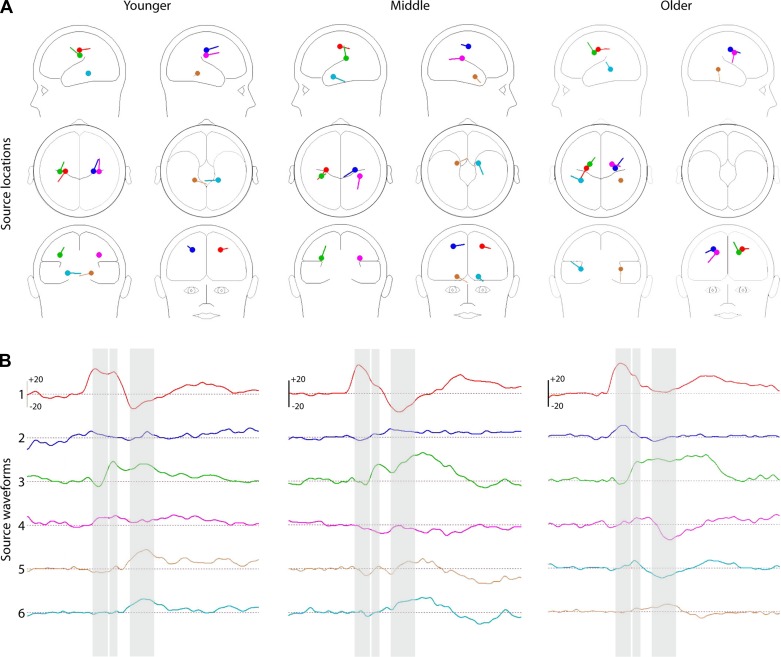
Fig. 5.
Source modeling of the SEP. Six-dipole model of the SEP, based on sequential modeling of the 3 major periods of activity within the first 195 ms following stimulus onset, for the young (left), middle (middle) and older (right) groups. A: head maps indicate relative regions of neural sources for each age group. Right and left are in radiological orientation, with left and right reversed. B: waveforms indicate the overall activity over time for each of the dipoles. Waveforms 1–6 correspond with dipoles by color.

