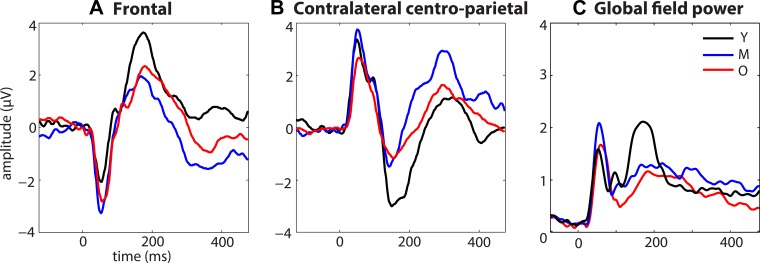
Fig. 6.
Developmental changes in overall SEP activity. A: developmental changes in frontal activity are apparent across age groups, with the middle group showing the most activity in the initial negative-going response at ∼55 ms and the younger group showing the most activity in the later positive-going response at ∼175 ms. B: the same pattern of differential activation as in A was seen, in inverted form, over the contralateral centroparietal region. C: global field power was also calculated to examine amplitude of the signal without regard to scalp topography. This confirmed the age-related differences in signal power, with the middle group showing increased activity in the early period and the younger group relatively increased activity in the later time window. Y, younger; M, middle; O, older.

