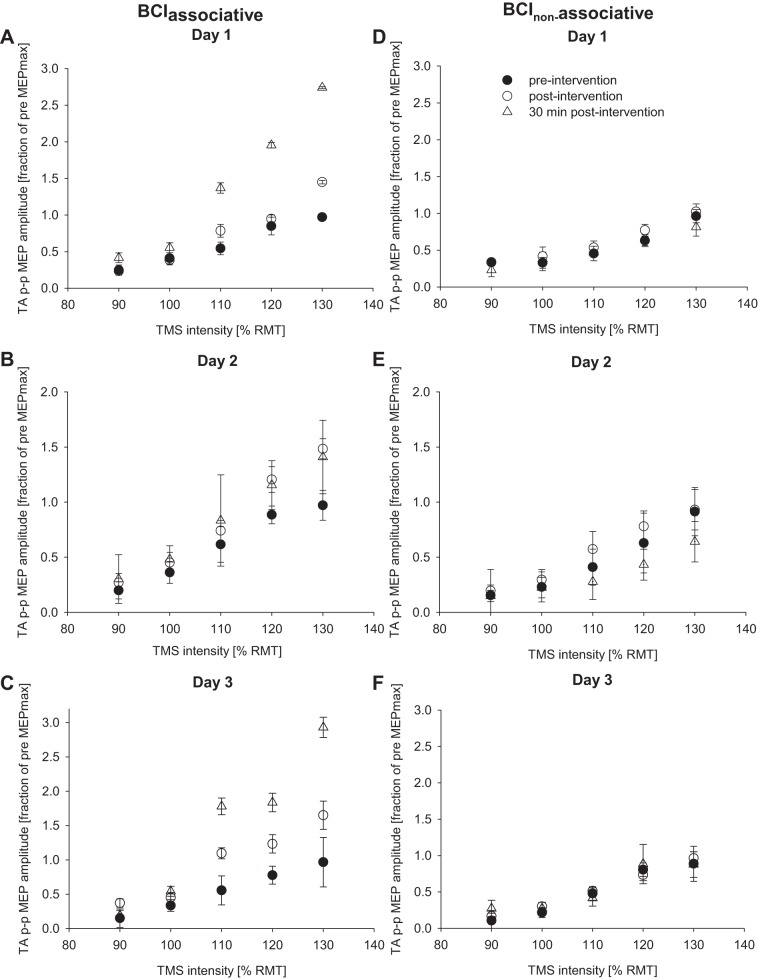
Fig. 3.
Input-output properties of the TA MEP before, immediately after, and 30 min after the cessation of the BCIassociative (A–C) and BCInonassociative (D–F) interventions across all subjects. TA MEP size is expressed as a fraction of the maximum peak-to-peak TA MEP (TA p-p MEP) amplitude before any intervention. Each graph represents a different day of the intervention, and each data point represents the average of 11 subjects (A–C) or 8 subjects (D–F). Error bars show SE. RMT, resting motor threshold.

