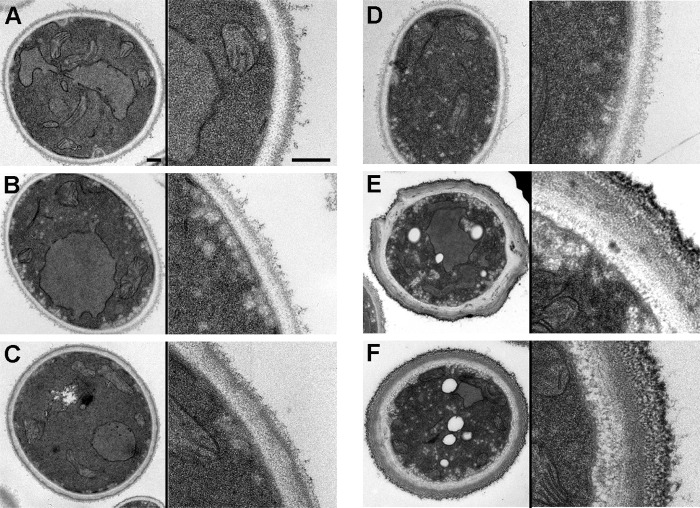
FIG 1.
Electron microscopy of ultrathin sections from C. tropicalis strains with different antifungal susceptibility profiles. Shown are representative fields of yeast cell wall from strains ATCC 750 (A), CL-7099 (B), CL-7119 (C), TP13650 (D), CL-6835 (E), and ATCC 200956 (F). In each panel, a picture of the whole cell (left part) and a magnification of the cell wall (right part) are shown. The scale bars correspond to 0.2 μm.

