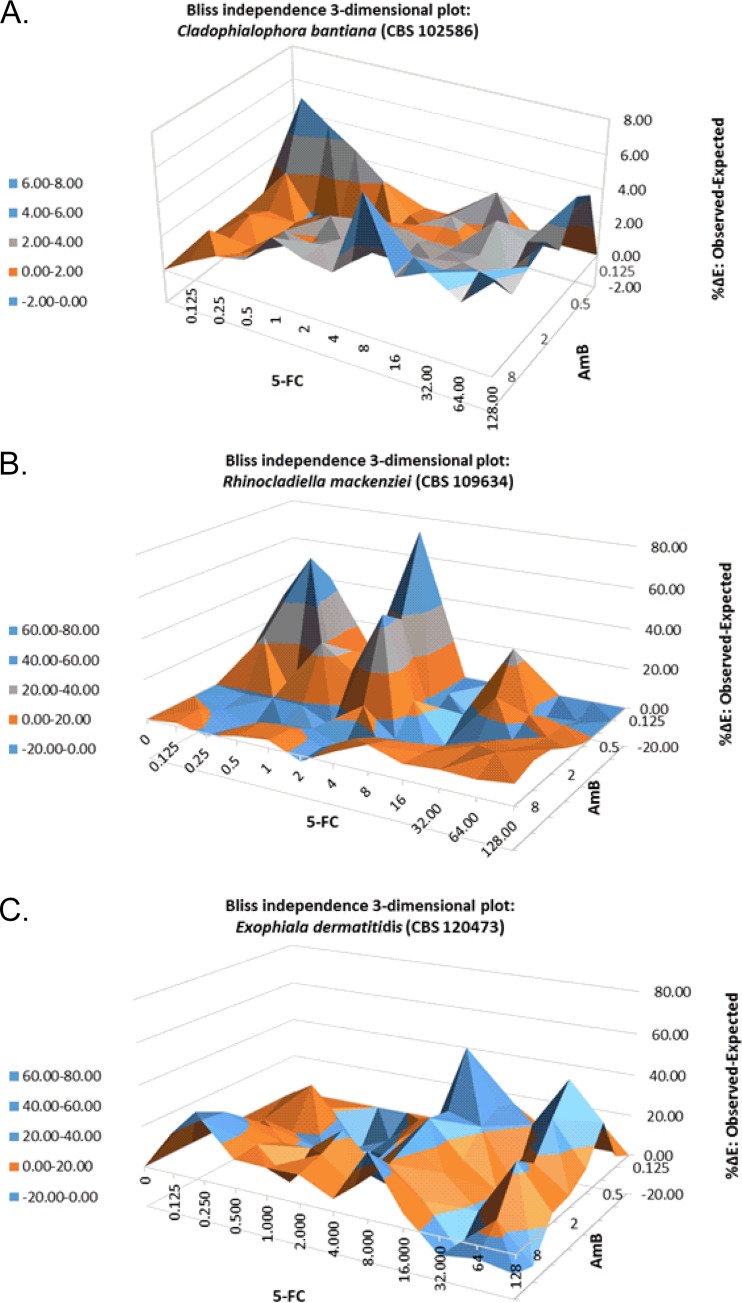
FIG 1.
Interaction surfaces obtained from response surface analysis of the Bliss independence no-interaction model for the in vitro combination of amphotericin B (AmB) and flucytosine (5-FC) against a Cladophialophora bantiana strain (CBS 102586) (AmB MIC, 0.25 μg/ml; 5-FC MIC, 2 μg/ml), a Rhinocladiella mackenziei strain (CBS 109634) (AmB MIC, 2 μg/ml; 5-FC MIC, 32 μg/ml), and an Exophiala dermatitidis strain (CBS 120473) (AmB MIC, 0.5 μg/ml; 5-FC MIC, 32 μg/ml). The x and y axes represent the efficacies of AmB and 5-FC, respectively. The z axis is ΔE, expressed as a percentage. The zero plane represents Bliss independent interactions, whereas values above the zero plane represent statistically significantly synergistic (positive ΔE) interactions. The magnitude of interactions is directly related to ΔE. The different tones in the 3-dimensional plots represent different percentile bands of synergy.

