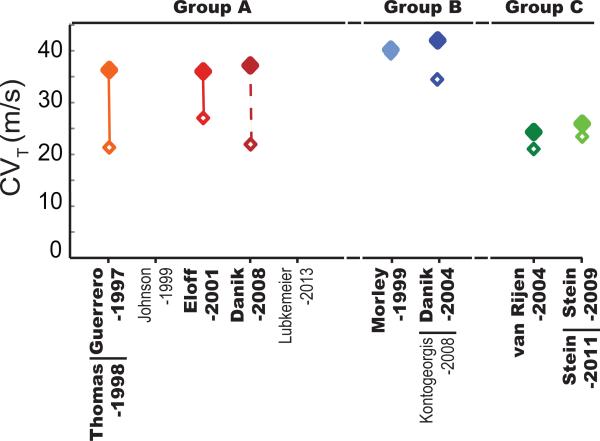
Figure 2. Conduction Velocity Classification.
Transverse CV reported in the discussed studies are classified into Groups A (Blue), B (Red) and C (Green) based on the perfusates used. Closed markers correspond to values reported in wild type mice and open markers correspond to values in mice with reduced Cx43. The lines connecting the open and closed markers indicates significant differences whereas absence of a connecting line indicates no significance. The dashed line between the Danik-2008 markers represents data that were not directly compared by statistical tests but report percent CV slowing similar to statistically significant groups. Data points are included only for manuscripts highlighted in Table 1.

