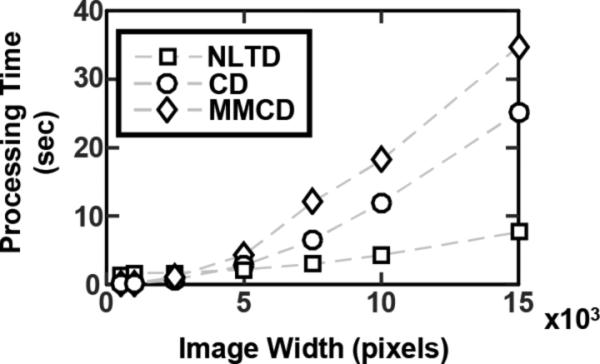
Figure 3. Processing time of NLTD and color deconvolution.

Comparison time for processing of images of various sizes using three different color normalization techniques: NLTD (squares), color deconvolution (CD, circles), and color deconvolution using Macencko's method of automated stain vector determination (MMCD, diamonds). Each image used was a three-dimensional RGB image, with side lengths defined by the x-axis. Processing time is shown on the y-axis in seconds as the median of 10 runs for each method at each image size.
