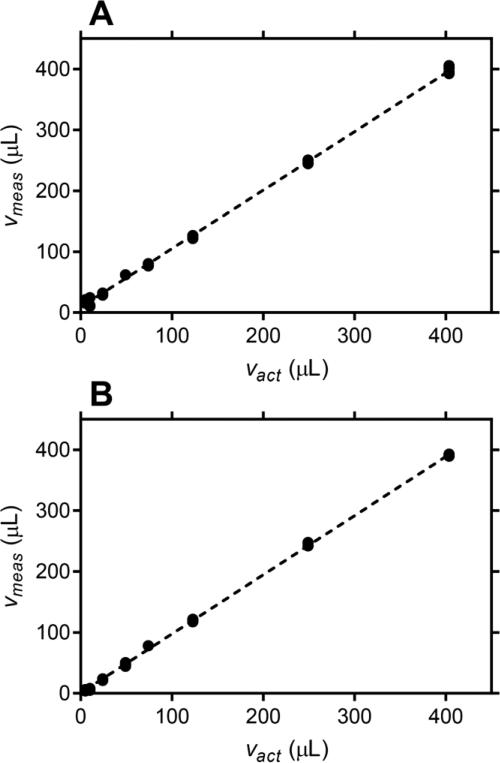
Fig. 4.
Plot of measured simulated CVF volume (Vmeas) versus actual simulated CVF volume (Vact) collected in 1 mL of CVL fluid. Four individual replicates are shown for each measurement and the broken line represents a linear fit to all data. (A) 1 mM Li+, slope = 0.9610 ± 0.0063, y-intercept = 8.909 ± 1.117 μL, R2 = 0.9987; and (B) 10 mM Li+, slope = 0.9706 ± 0.00372, y-intercept = 0.4794 ± 0.6568 μL, R2 = 0.9996.

