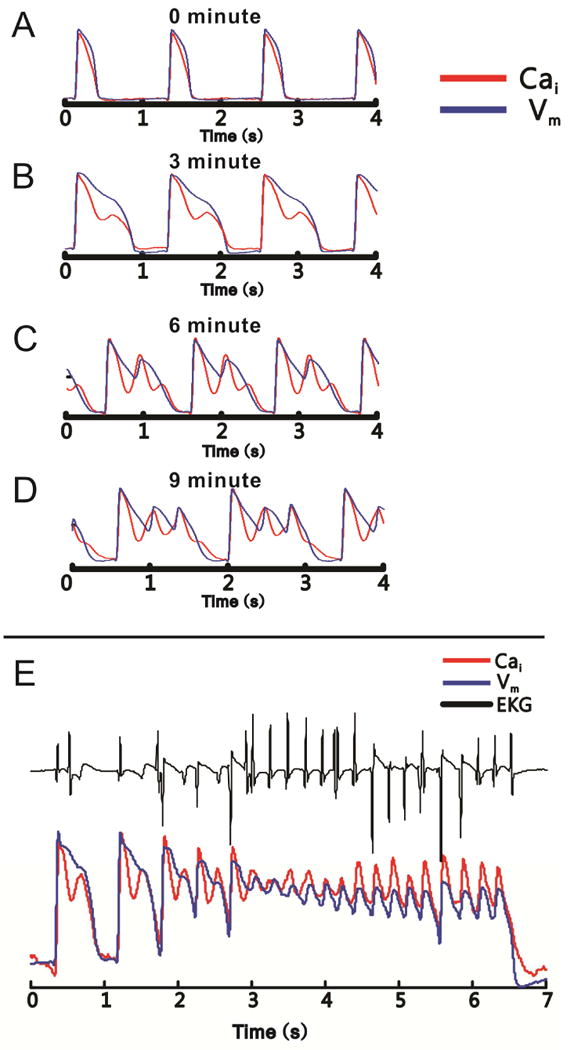
Figure 1.

Development of SSCEs precedes the onset of TdP. Simultaneous recordings of membrane voltage (blue) and Ca2+ signals (red) are shown in all panels. A: During slow pacing before IKr block, the AP and CaT waveforms are monophasic and similar. B: After IKr block, but before the development of EADs, AP prolongation is accompanied by complex, biphasic CaT, with an SSCE following the initial rise of the CaT. C: With increasingly more robust IKr block, the amplitude of the SSCE increases and a corresponding EAD develops. Note that the rise of SSCEs precedes the EAD upstroke, and that a second SSCE of smaller amplitude develops during AP downstroke. D: Eventually, the SSCE increases in amplitude and develops its own EAD. E: Finally, long plateaus with superimposed oscillations of both membrane voltage and Ca2+ signal occur. They correspond to runs of polymorphic ventricular tachycardia on EKG (black). Adapted from41
