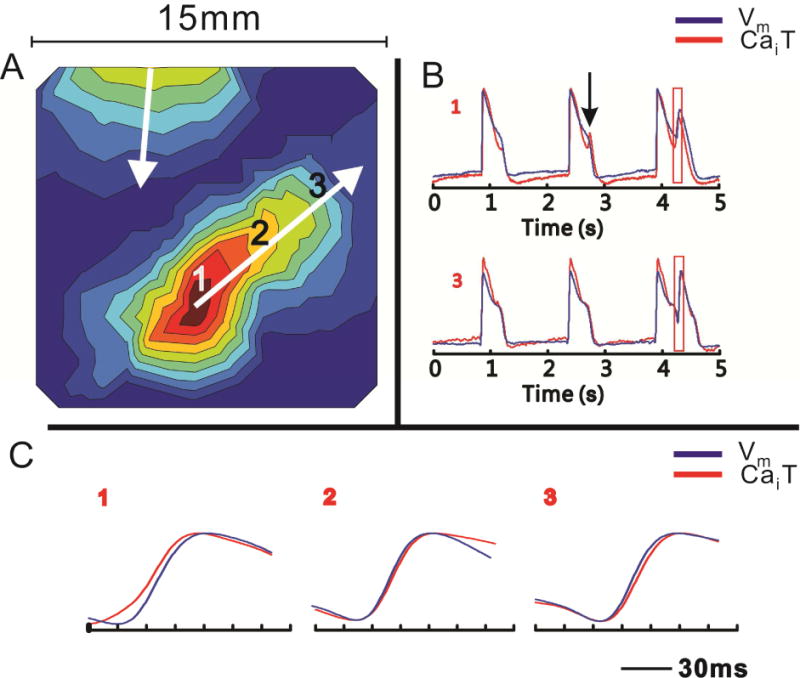
Figure 2.

SSCE precedes EAD at the site of origin of the corresponding ectopic beat. A: An activation map of a propagated ectopic beat with an origin at site 1; the depolarization wavefront proceeds from red to blue regions. B: Simultaneous CaT and AP signals from the beat focus (site 1) and a distant site (site 3). Secondary CaT upstroke precedes secondary AP upstroke at site 1, but trails it at site 3. Note the tiny SSCE is not followed by an EAD on the seconds beat at site 1 (vertical arrow). C: Similar to panel B, but at displayed with better time resolution. Note the shift in relative positions of the CaT and AP upstrokes between sites 1 and 3. Adapted from41
