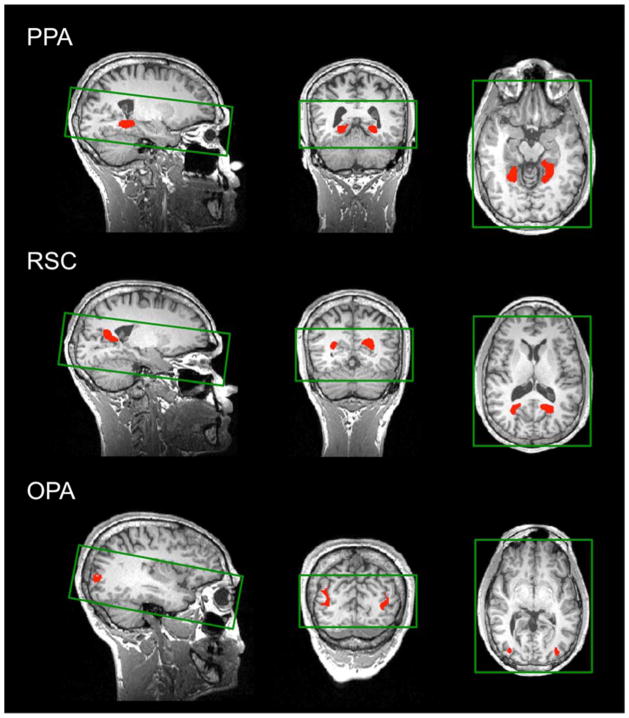
Figure 2.
Using independent data, PPA, RSC, and OPA (shown in red) were localized as regions that responded more strongly to scenes than objects (p < 10−4). The green rectangles overlaid on the brain images show the slice prescription used in the experiment (16 slices). Note that the slice prescription covered the entirety of the occipital and temporal lobes in all subjects, and thus we were able to capture all of the ROIs.

