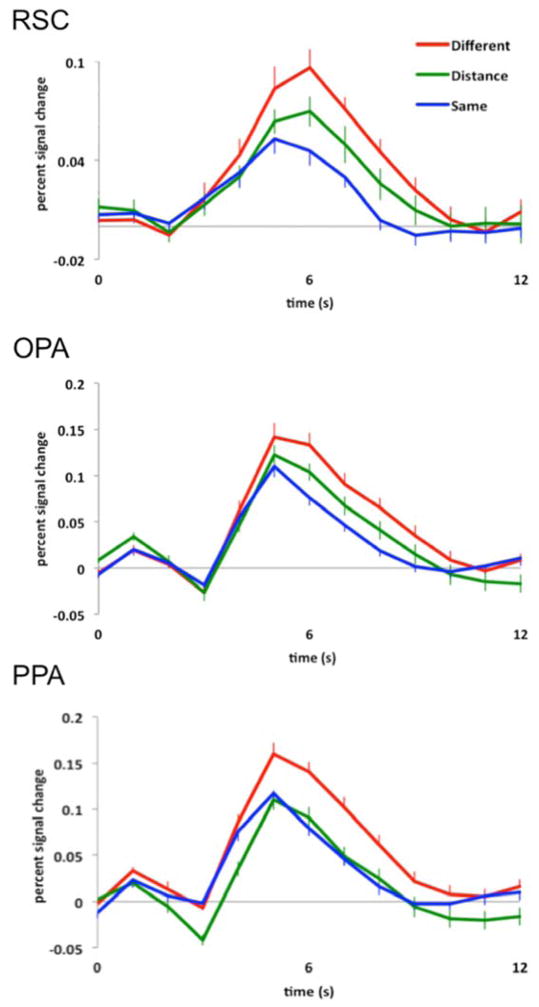
Figure 3.
Hemodynamic time courses (percentage signal change) of three scene selective regions of cortex, RSC, OPA, and PPA to (1) two completely different images of scenes (red line labeled “Different”), (2) the same image of a scene presented twice (blue line labeled “Same”), and (3) an image of a scene viewed from either a proximal or distal perspective followed by the opposite version of the same stimulus (green line labeled “Distance”). Note sensitivity to egocentric distance information in both RSC and OPA, but invariance to such information in PPA.

