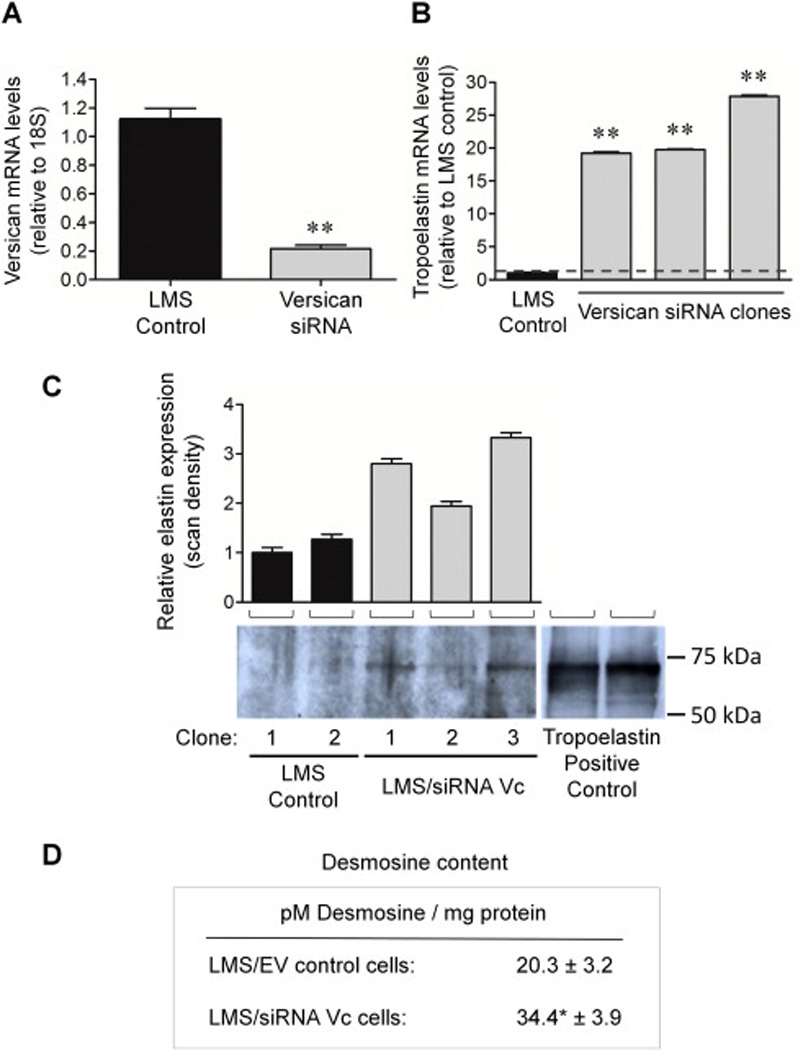
Figure 1. siRNA-mediated knockdown of versican leads to a corresponding increase in elastin expression, accumulation, and levels of mature elastin (desmosine).

(A) qRT-PCR demonstrates on average a 79% knockdown of versican mRNA using versican-directed siRNA (n = 7; gray columns) compared to controls (n = 4; black columns). (B) A corresponding 12- to 29-fold increase in tropoelastin expression (gray columns) is observed in all the LMS clones constitutively expressing versican-directed siRNA compared to LMS/EV controls. The results of three clones are shown. ** p < 0.01. (C) Representative Western blot probed with anti-bovine tropoelastin detecting 70 kDa tropoelastin in lysates of empty vector clone and siRNA versican LMS cells in culture. All lanes were loaded with equal protein (20 µg). Lanes 1 and 2 show little or no elastin, while lanes 3, 4, and 5 show detectable elastin levels. Lanes 6 and 7 are positive controls of full-length tropoelastin which migrate at the same molecular weight as the cell culture sample extracts. Molecular weight range of ∼50 to 100 kDa is shown. Densitometry in upper panel represents the relative elastin expression ± SE; LMS control (black) vs. LMS/siRNA Vc cells (gray). The relative elastin expression level of each of the samples was made in comparison to the LMS/EV control in lane 1 (set to one). (D) Desmosine content was measured in LMS/EV control cells (n = 5) and compared to LMS/siRNA Vc cells (n = 5) and was approximately 70% greater in the versican siRNA cells vs. the control LMS cells. Mean ± SE; * p < 0.05.
